热门资讯> 正文
Ares Capital的净资产净值、股息和估值与14位BDS同行的对比-第1部分(2019年第一季度后收益)
2019-05-27 22:00
Part 1 of this article compares ARCC’s recent quarterly change in NAV, quarterly and trailing twelve-month economic return, NII, and current valuation to fourteen BDC peers.
Part 1 also performs a comparative analysis between each company’s investment portfolio as of 12/31/2018 and 3/31/2019. This includes the percentage of investments on non-accrual status.
Other metrics analyzed include each company’s cumulative realized gain (loss) per share, NII per share, price to annualized NII ratio, and percentage of income attributable to capitalized PIK income.
My buy, sell, or hold recommendation and updated price target for ARCC is stated in the “Conclusions Drawn” section of the article.
I also provide a list of the other BDC stocks I currently believe are undervalued (a buy recommendation), appropriately valued (a hold recommendation), and overvalued (a sell recommendation).
The focus of PART 1 of this article is to analyze Ares Capital Corp.’s (
ARCC
) recent results and compare several of the company’s metrics to fourteen business development company (“BDC”) peers. This analysis will show past and current data with supporting documentation within two tables. Table 1 will compare ARCC’s recent net asset value (“NAV”), economic return, net investment income (“NII”), stock price to annualized NII ratio, and percentage of total investment income attributable to capitalized payment-in-kind (“PIK”) income to the fourteen BDC peers. Table 1 will also provide a premium (discount) to NAV analysis using stock prices as of 5/24/2019. Table 2 will compare ARCC’s investment portfolio (including several additional metrics) as of 12/31/2018 and 3/31/2019 to the fourteen BDC peers.
I am writing this two-part article due to the continued requests that such an analysis be specifically performed on ARCC and some of the company’s BDC peers at periodic intervals. These BDC peers include Apollo Investment Corp. (
OTC:AINV
), FS KKR Capital Corp. (
FSK
), Gladstone Investment Corp. (
GAIN
), Golub Capital BDC Inc. (NASDAQ:
GBDC
), Main Street Capital Corp. (
MAIN
), Medley Capital Corp. (
MCC
), NEWTEK Business Services Corp. (
NEWT
), Oaktree (
OAK
) Strategic Income Corp. (
OCSI
), Oaktree Specialty Lending Corp. (
OCSL
), PennantPark Floating Rate Capital Ltd. (
PFLT
), Prospect Capital Corp. (
PSEC
), Solar Capital, Ltd. (
SLRC
), BlackRock (
BLK
) TCP Capital Corp. (
TCPC
), and TPG Specialty Lending Corp. (
TSLX
). I am currently not planning on expanding my BDC coverage list over the foreseeable future due to the fact I fully cover twenty mortgage real estate trust (mREIT) and a handful of other stocks on Seeking Alpha.
Understanding the general characteristics of each BDC’s investment portfolio and operating performance can shed some light on which companies are overvalued or undervalued strictly per a
analysis. This is not the only data that should be examined to initiate a position within a particular stock/sector. However, I believe this analysis would be a good
to begin a discussion on the topic. My BUY, SELL, or HOLD recommendation and current price target for ARCC will be in the
section of the article. This includes providing a list of the BDC stocks I currently believe are undervalued (a buy recommendation), appropriately valued (a hold recommendation), and overvalued (a sell recommendation).
Let us start this analysis by second getting accustomed to the information provided in Table 1 below. This will be beneficial when explaining how ARCC compares to the company’s fourteen BDC peers regarding the metrics stated above. Due to the fact several BDC peers listed in Table 1 have a different fiscal year-end, all quarterly results are based on a calendar year-end. For instance, all metrics below are stated
even though this does not correspond to every company’s fiscal year-end. Readers should be aware as such when the analysis is presented below.
Table 1 –NAV, Economic Return (Loss), Current Premium (Discount) to NAV, NII, and Capitalized PIK Analysis
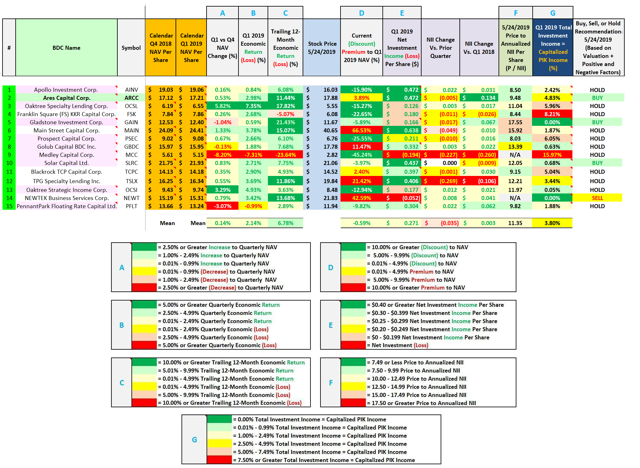
(Source: Table created by me, obtaining historical stock prices from
Nasdaq
and each company’s NAV per share figures from the
SEC’s EDGAR Database
)
Table 1 above provides the following information on ARCC and the fourteen BDC peers (see each corresponding column):
;
;
;
;
;
;
;
;
;
;
;
; and
Now that an overview has been provided, let us start the comparative analysis.
Using Table 1 above as a reference, ARCC had a NAV of $17.12 per share at the end of the calendar fourth quarter of 2018. ARCC had a NAV of $17.21 per share at the end of the calendar first quarter of 2019. This calculates to a quarterly NAV increase of $0.09 per share or 0.53%. When including ARCC’s quarterly and special periodic dividend of $0.40 and $0.02 per share respectively, the company had an economic return (change in NAV and accrued dividend) of $0.51 per share or 2.98% for the calendar first quarter of 2019. It should also be noted ARCC had a trailing twelve-month economic return of $1.95 per share or 11.44% which outperformed the majority of BDC peers within this analysis (GAIN had the largest economic return).
ARCC’s performance during the past four quarters was mainly attributable to the following two factors:
; and
. This is a good transition to the next topic of discussion, an analysis of ARCC’s investment portfolio (including several additional metrics) as of 12/31/2018 and 3/31/2019. To begin this analysis, Table 2 is provided below.
Table 2 – Investment Portfolio Composition Analysis (Including Several Additional Metrics; 3/31/2019 Versus 12/31/2018)
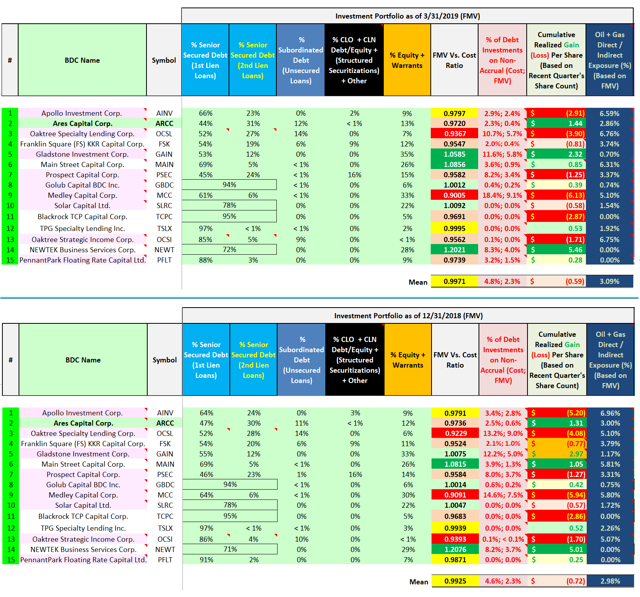
(Source: Table created by me, directly obtaining some figures/percentages from the SEC’s EDGAR Database [link provided below Table 1]. All remaining figures/percentages were calculated using data obtained within the SEC’s EDGAR Database)
Using Table 2 above as a reference, ARCC had 44% and 31% of the company’s investment portfolio in senior secured first- and second-lien loans as of 3/31/2019, respectively. As such, these types of loans comprised the majority of ARCC’s investment portfolio. When compared to the prior quarter, ARCC’s percentage of senior secured first- and second-lien loans decreased (3%) and increased 1%, respectively. ARCC also had 12%, less than 1%, and 13% of the company’s investment portfolio in subordinated debt (unsecured loans), collateralized loan obligation (“CLO”)/credit-linked notes (“CLN”) (structured securitizations) + other, and equity/warrants, respectively. When compared to the prior quarter, ARCC’s percentage of subordinated debt (unsecured loans), CLO/CLN (structured securitizations) + other, and equity/warrants increased 1%, remained unchanged, and increased 1%, respectively. As such, there was no notable shift in investment portfolio composition during the calendar first quarter of 2019.
As of 3/31/2019, ARCC’s investment portfolio had a
ratio of 0.9720x. When compared to the fourteen BDC peers within this analysis, this ratio was slightly below the mean of 0.9971x. When compared to a ratio of 0.9736x as of 12/31/2018, ARCC’s ratio slightly decreased during the calendar first quarter of 2019. ARCC had 2.3% and 0.4% of the company’s investment portfolio on
status as of 3/31/2019; based on its amortized cost basis and FMV, respectively. When compared to the fourteen BDC peers as of 3/31/2019, ARCC’s amortized cost and FMV non-accrual percentage was modestly below the mean of 4.8% and 2.3%, respectively. In addition, unlike some BDC peers, ARCC’s non-accrual percentages did not experience an
during the calendar third or fourth quarters of 2018 (a positive catalyst/trend).
Since the company’s initial public offering (“IPO”), ARCC’s investment portfolio as of 3/31/2019 had generated a cumulative realized gain of $1.44 per share (when based on a per share count as of 3/31/2019). When compared to the fourteen BDC peers within this analysis, ARCC had the third largest cumulative realized gain per share amount as of 3/31/2019 (another positive catalyst/factor). ARCC’s cumulative realized gain (loss) figure was notably more attractive when compared to the mean of ($0.59) per share. I believe calculating a BDC’s cumulative realized gain (loss) per share amount provides an extremely useful metric when analyzing the long-term performance of management’s underwriting abilities, due diligence, and expertise.
This metric provides direct evidence ARCC’s management team has continued to find attractive debt/equity investments over a long period of time which, more times than not, have ultimately delivered attractive risk-adjusted returns.
I am the only contributor on Seeking Alpha to provide this specific metric (also considers Marketplace services;
includes reconciling all necessary cumulative adjustments within this account to provide a
per share amount). This holds especially true due to the recent Generally Accepted Accounting Principles (“GAAP”) disclosure change when it comes to equity presentation.
As of 3/31/2019, 2.86% of ARCC’s portfolio had debt and equity investments within the oil and gas sector (including certain investments in the energy sector which had
characteristics and/or services closely linked to the sector). When compared to the fourteen BDC peers within this analysis, ARCC’s oil and gas exposure was slightly below the mean of 3.09%. When compared to the prior quarter, ARCC’s exposure to the oil and gas sector slightly decreased; mainly due to FMV fluctuations and portfolio runoff.
Once again using Table 1 as a reference, ARCC’s NII of $0.472 per share during the calendar first quarter of 2019 exceeded all but two BDC peers within this analysis. When comparing each company’s stock price as of 5/24/2019 to its annualized NII, ARCC had the fifth lowest ratio at 9.48x (another positive catalyst/factor). ARCC’s current annualized NII ratio is more attractive when compared to the peer ratio of 11.35x as of 5/24/2019 (even with the recent modest increase in stock price).
During the calendar first quarter of 2019, 4.83% of ARCC’s total investment income was attributable to capitalized PIK income which was an increase of 1.35% when compared to the prior quarter (a
factor/trend). When compared to the fourteen BDC peers within this analysis, this was slightly above the mean of 3.80%. I believe it is never a positive catalyst/trend when a BDC has any portion of its accrued income classified as being capitalized/deferred. Simply put, under GAAP, PIK income is revenue that is currently being
but has not actually been received in cash. In a majority of cases, capitalized PIK income is paid in cash at maturity/when a sale occurs.
However, more times than not, capitalized PIK income is a contractual amendment regarding a portfolio company who is, at the time, having operational difficulties (which increases the probability of the inability of paying its loan obligations). As such, it is usually the case capitalized PIK income is never
received in cash upon maturity/when a sale occurs. In my professional opinion, if a BDC has a large/above average portion of its investment income classified/accrued as capitalized PIK income, it should be seen as a concern regarding future performance/credit quality.
As of 5/24/2019 ARCC’s stock price traded at $17.88 per share. When calculated, ARCC’s stock price was trading at a premium to NAV as of 3/31/2019 of $0.67 per share or 3.89%.
Many readers have continued to request that I provide various metrics for the BDC stocks I currently cover in ranking order. As such, using Table 1 above as a reference, the following were the economic return (loss) percentages for ARCC and the fourteen BDC peers during the trailing twelve months (in order of highest to lowest economic return/lowest to highest economic loss; very good indication of recent overall performance):
6) ARCC: 11.44% economic return
Next, the following were the non-accrual percentages for ARCC and the fourteen BDC peers as of 3/31/2019 (in order of lowest to highest percentage; based on amortized cost [excluding any debt-to-equity exchanges and recently written-off/sold investments]):
7) ARCC: 2.3% non-accrual rate (2.5% as of 12/31/2018)
Next, the following were the cumulative realized gain (loss) per share amounts for ARCC and the fourteen BDC peers as of 3/31/2019 (share count as of 3/31/2019; excluding AINV’s recent reverse 1:3 stock split in order to more accurately present past performance) in order of highest to lowest realized gain/lowest to highest realized loss [great indication of long-term performance of management’s underwriting abilities/due diligence/expertise]):
3) ARCC: $1.44 per share cumulative realized gain (IPO = 2004)
Next, the following were the 5/24/2019 premium (discount) to NAV as of 3/31/2019 percentages for ARCC and the fourteen BDC peers (in order of largest to smallest discount/smallest to largest premium):
11) ARCC: 3.89% premium to NAV as of 3/31/2019
Next, the following were the NII (loss) per share amounts for ARCC and the fourteen BDC peers during the calendar first quarter of 2019 (in order of highest to lowest NII per share/lowest to highest net investment loss per share):
2) ARCC: $0.472 per share NII; ($0.005) decrease versus Q4 2018; $0.134 increase versus Q1 2018
Next, the following were the 5/24/2019 stock price to annualized NII per share amounts for ARCC and the fourteen BDC peers during the calendar first quarter of 2019 (in order of lowest to highest ratio):
5) ARCC: 9.48x (9.16x as of 2/22/2019)
Finally, the following were the percentage of total investment income attributable to capitalized PIK (deferred) income for ARCC and the fourteen BDC peers during the calendar first quarter of 2019 (in order of lowest to highest percentage [very good indication of overall health of investment portfolio]):
10) ARCC: 4.83% capitalized PIK income (3.48% last quarter)
PART 1 of this article has analyzed ARCC and fourteen BDC peers in regards to the following metrics:
;
;
;
;
;
; and
When compared to the fourteen BDC peers within this analysis, I believe ARCC once again outperformed most of the company’s BDC peers I currently cover during the calendar first quarter of 2019. This includes, but be not limited to, ARCC’s NII per share, economic return percentage, and trailing twelve-month economic return percentage (a positive factor/trend). This article also highlighted ARCC had a relatively average FMV versus cost ratio, modestly below average investments on non-accrual status, slightly below average exposure to the oil and gas sector (including certain investments in the energy sector which had oil and gas characteristics and/or services closely linked to the sector), and the third highest cumulative realized gain per share amount as of 3/31/2019.
In addition, I would also point out ARCC had, by far, the largest year-over-year quarterly NII increase out of the BDC peers within by analysis. ARCC’s NII for the calendar first quarter of 2019 of $0.472 per share was an increase of $0.134 per share when compared to NII of $0.338 per for from the calendar first quarter of 2018. Along with the typical fairly close relationship between NII and net investment company taxable income (“ICTI”), this provides direct evidence why ARCC has been able to increase both the company’s quarterly dividend per share rate over the past year and provide a small quarterly special periodic dividend during calendar year 2019.
While ARCC traded at a minor (less than 5%) premium to NAV and at a minor premium versus the mean of the BDC peers within this analysis, I believe the metrics laid out in this two-part article provide factual, quantitative support as to why this company deserves to trade at an even larger premium to most of the BDC peers within this analysis and more towards the current NAV premium of GBDC (some could even argue more towards TSLX).
Over the past year, even though ARCC’s stock price has slightly net increased, the company’s stock price to annualized NII per share ratio has remained below 10.00x. I believe this fact helps support the notion ARCC remains undervalued and should trade at a higher multiple versus most sector peers (not lower).
From the analysis provided above, including additional factors not discussed within this article, I currently rate ARCC as a SELL when the company’s stock price is trading at or greater than a 15.0% premium to the mean of my ARCC projected NAV as of 6/30/2019 range ($17.15 per share), a HOLD when trading at greater than a 5.0% but less than a 15.0% premium to the mean of my ARCC projected NAV as of 6/30/2019 range, and a BUY when trading at or less than a 5.0% premium to the mean of my ARCC projected NAV as of 6/30/2019 range. These ranges are a slight increase when compared to my last ARCC article (approximately 2.5 months ago).
Therefore, I currently rate ARCC as a BUY. As such, I currently believe ARCC is undervalued. My current price target for ARCC is approximately $19.80 per share.
This is currently the price where my recommendation would change to a SELL. This price target is a $0.30 per share increase when compared to my last ARCC article.
The current price where my recommendation would change to a HOLD is approximately $18.00 per share.
This price is a $0.20 per share increase when compared to my last ARCC article.
For additional support on my BUY, SELL, or HOLD recommendation, I discussed ARCC’s 2019 dividend sustainability in the following article last November (dividend projections were extremely accurate versus recent declarations regarding both quarterly and special periodic dividends):
As of 5/24/2019, I currently have the following recommendation for the fourteen BDC peers within this analysis:
While I do find NEWT attractive from an operations/portfolio perspective, I also believe, when compared to some of the other BDC peers, this stock is currently slightly-modestly overvalued. For long-term holders of NEWT, this indicates I personally would not currently add to my existing position at current prices (if I held a position; which I do not).
The analysis performed above does not provide
catalyst/factor to consider when choosing a BDC investment. However, I believe this analysis is a good starting point to begin a discussion on the topic. Additional metrics will be analyzed in PART 2 of this article. PART 2 will take a look at ARCC’s past and current dividend rates, yields, and other similar metrics and compare the results to these fourteen BDC peers. Several of these metrics have a direct impact on future operations/results as events unfold.
Each investor's BUY, SELL, or HOLD decision is based on one's risk tolerance, time horizon, and dividend income goals. My personal recommendation will not fit each reader’s current investing strategy.
The factual information provided within this article is intended to help assist readers when it comes to investing strategies/decisions.
On 10/12/2018, I initiated a position in ARCC at a weighted average purchase price of $16.40 per share. On 12/10/2018, 12/18/2018, and 12/21/2018, I increased my position in ARCC at a weighted average purchase price of $16.195, $15.305, and $14.924 per share, respectively. When combined, my ARCC position has a weighted average purchase price of $15.293 per share. This weighted average per share price excludes all dividends received/reinvested. Each ARCC trade was disclosed to readers in real time (that day) via the StockTalks feature of Seeking Alpha.
On 9/6/2017, I re-entered a position in PSEC at a weighted average purchase price of $6.765 per share. On 10/16/2017 and 11/6/2017, I increased my position in PSEC at a weighted average purchase price of $6.285 and $5.66 per share, respectively. When combined, my PSEC position has a weighted average purchase price of $6.077 per share. This weighted average per share price excludes all dividends received/reinvested. Each PSEC trade was disclosed to readers in real time (that day) via the StockTalks feature of Seeking Alpha.
On 2/2/2018, I re-entered a position in MAIN at a weighted average purchase price of $37.425 per share. On 2/5/2018, 3/1/2018, 10/4/2018, 10/23/2018, 12/18/2018, and 12/21/2018, I increased my position in MAIN at a weighted average purchase price of $35.345, $35.365, $37.645, $36.674, $35.305, and $33.045 per share, respectively. When combined, my MAIN position has a weighted average purchase price of $34.713 per share. This weighted average per share price excludes all dividends received/reinvested. Each MAIN trade was disclosed to readers in real time (that day) via the StockTalks feature of Seeking Alpha.
On 6/5/2018, I initiated a position in TSLX at a weighted average purchase price of $18.502 per share. On 6/14/2018, I increased my position in TSLX at a weighted average purchase price of $17.855 per share. My second purchase was approximately double the monetary amount of my initial purchase. When combined, my TSLX position has a weighted average purchase price of $18.071 per share. This weighted average per share price excludes all dividends received/reinvested. Each TSLX trade was disclosed to readers in real time (that day) via the StockTalks feature of Seeking Alpha.
On 10/12/2018, I re-entered a position in NEWT at a weighted average purchase price of $18.355 per share. On 12/21/2018, I increased my position in NEWT at a weighted average purchase price of $15.705 per share, respectively. When combined, my NEWT position had a weighted average purchase price of $16.462 per share. This weighted average per share price excluded all dividends received/reinvested. On 4/8/2019 and 4/11/2019, I sold my entire position in NEWT at a weighted average sales price of $21.157 per share as my price target, at the time, of $21.10 per share was met. This calculates to a non-annualized realized gain of 28.5% and a non-annualized total return (when including weighted average dividends received) of 34.0%. These NEWT trades were disclosed to readers in real time (that day) via the StockTalks feature of Seeking Alpha.
On 10/12/2018, I initiated a position in SLRC at a weighted average purchase price of $20.655 per share. On 12/18/2018, I increased my position in SLRC at a weighted average purchase price of $19.66 per share, respectively. When combined, my SLRC position has a weighted average purchase price of $19.909 per share. This weighted average per share price excludes all dividends received/reinvested. Each SLRC trade was disclosed to readers in real time (that day) via the StockTalks feature of Seeking Alpha.
On 3/13/2019, I initiated a position in GAIN at a weighted average purchase price of $11.625 per share. This weighted average per share price excludes all dividends received/reinvested. This GAIN trade was disclosed to readers in real time (that day) via the StockTalks feature of Seeking Alpha.
All trades/investments I have performed over the past several years have been disclosed to readers in real time (that day at the latest) via the StockTalks feature of Seeking Alpha (which cannot be changed/altered). Through this resource, readers can look up all my prior disclosures (buys/sells) regarding all companies I cover here at Seeking Alpha (see my profile page for a list of all stocks covered).
Through StockTalk disclosures, at the end of April 2019 I had an unrealized/realized gain
of 92.5% and a total return (includes dividends received) success rate of 100% out of 40 total positions (updated monthly; multiple purchases/sales in one stock count as one overall position until fully closed out [no realized total losses]).
I encourage other Seeking Alpha contributors to provide real-time buy and sell updates for their readers which would ultimately lead to greater transparency/credibility.
I am/we are long ARCC, BLK, GAIN, MAIN, PSEC, SLRC, TSLX.
I wrote this article myself, and it expresses my own opinions. I am not receiving compensation for it (other than from Seeking Alpha). I have no business relationship with any company whose stock is mentioned in this article.
Additional disclosure:
I currently have no position in AINV, BDCL, BDCS, BIZD, FSK, GBDC, MCC, NEWT, OAK, OCSI, OCSL, PFLT, or TCPC.
推荐文章
港股周报 | 中国大模型“春节档”打响!智谱周涨超138%;巨亏超230亿!美团周内重挫超10%

一周财经日历 | 港美股迎“春节+总统日”双假期!万亿零售巨头沃尔玛将发财报
一周IPO | 赚钱效应持续火热!年内24只上市新股“0”破发;“图模融合第一股”海致科技首日飙涨逾242%
从软件到房地产,美国多板块陷入AI恐慌抛售潮
Meta计划为智能眼镜添加人脸识别技术
危机四伏,市场却似乎毫不在意
美股机会日报 | 降息预期升温!美国1月CPI年率创去年5月来新低;净利、指引双超预期!应用材料盘前涨超10%
财报前瞻 | 英伟达Q4财报放榜在即!高盛、瑞银预计将大超预期,两大关键催化将带来意外惊喜?
