热门资讯> 正文
Examining the Future: Kadant's Earnings Outlook
2025-10-28 03:02
Kadant (NYSE:KAI) is set to give its latest quarterly earnings report on Tuesday, 2025-10-28. Here's what investors need to know before the announcement.
Analysts estimate that Kadant will report an earnings per share (EPS) of $2.17.
Anticipation surrounds Kadant's announcement, with investors hoping to hear about both surpassing estimates and receiving positive guidance for the next quarter.
New investors should understand that while earnings performance is important, market reactions are often driven by guidance.
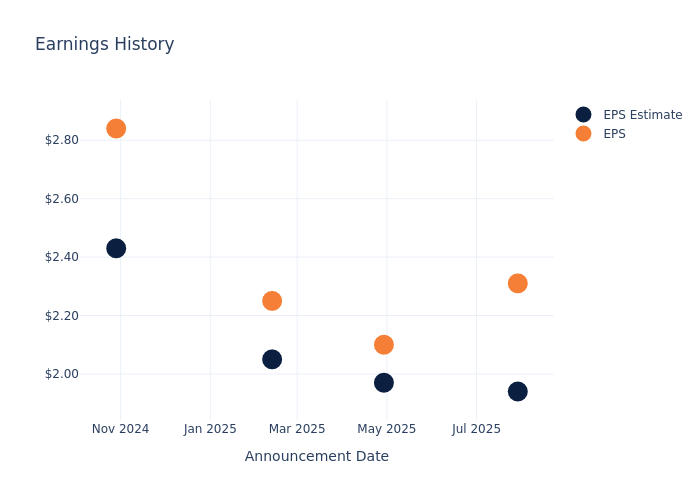
Overview of Past Earnings
The company's EPS beat by $0.37 in the last quarter, leading to a 4.12% increase in the share price on the following day.
Here's a look at Kadant's past performance and the resulting price change:
| Quarter | Q2 2025 | Q1 2025 | Q4 2024 | Q3 2024 |
|---|---|---|---|---|
| EPS Estimate | 1.94 | 1.97 | 2.05 | 2.43 |
| EPS Actual | 2.31 | 2.10 | 2.25 | 2.84 |
| Price Change % | 4.00 | -7.00 | -1.00 | 5.00 |
Tracking Kadant's Stock Performance
Shares of Kadant were trading at $291.01 as of October 24. Over the last 52-week period, shares are down 4.65%. Given that these returns are generally negative, long-term shareholders are likely bearish going into this earnings release.
Analyst Insights on Kadant
For investors, staying informed about market sentiments and expectations in the industry is paramount. This analysis provides an exploration of the latest insights on Kadant.
Analysts have given Kadant a total of 6 ratings, with the consensus rating being Outperform. The average one-year price target is $366.67, indicating a potential 26.0% upside.
Understanding Analyst Ratings Among Peers
In this comparison, we explore the analyst ratings and average 1-year price targets of Standex International, Worthington Enterprises and Franklin Electric, three prominent industry players, offering insights into their relative performance expectations and market positioning.
- Analysts currently favor an Buy trajectory for Standex International, with an average 1-year price target of $226.0, suggesting a potential 22.34% downside.
- Analysts currently favor an Buy trajectory for Worthington Enterprises, with an average 1-year price target of $73.0, suggesting a potential 74.91% downside.
- Analysts currently favor an Neutral trajectory for Franklin Electric, with an average 1-year price target of $107.0, suggesting a potential 63.23% downside.
Snapshot: Peer Analysis
The peer analysis summary presents essential metrics for Standex International, Worthington Enterprises and Franklin Electric, unveiling their respective standings within the industry and providing valuable insights into their market positions and comparative performance.
| Company | Consensus | Revenue Growth | Gross Profit | Return on Equity |
|---|---|---|---|---|
| Kadant | Outperform | -7.10% | $117.04M | 2.90% |
| Standex International | Buy | 23.23% | $91.30M | 2.12% |
| Worthington Enterprises | Buy | 18.03% | $82.28M | 3.71% |
| Franklin Electric | Neutral | 8.13% | $211.83M | 4.68% |
Key Takeaway:
Kadant ranks at the bottom for Revenue Growth among its peers. It is at the top for Gross Profit. For Return on Equity, Kadant is at the bottom. Overall, Kadant's performance is mixed compared to its peers.
Discovering Kadant: A Closer Look
Kadant Inc. supplies process and engineering equipment for papermaking, recycling, lumber manufacturing, and related industries. The company's three reportable segments are the Flow Control segment which consists of the fluid-handling and doctoring, cleaning, & filtration product lines; the Industrial Processing segment which consists of the wood processing and stock-preparation product lines; and Material handling systems, which provides conveyor-belt equipment for industries such as mining, food processing, and packaging. The company has a geographic presence in the U.S., China, Asia, Germany, Canada, and Others.
Understanding the Numbers: Kadant's Finances
Market Capitalization Analysis: The company exhibits a lower market capitalization profile, positioning itself below industry averages. This suggests a smaller scale relative to peers.
Decline in Revenue: Over the 3 months period, Kadant faced challenges, resulting in a decline of approximately -7.1% in revenue growth as of 30 June, 2025. This signifies a reduction in the company's top-line earnings. In comparison to its industry peers, the company trails behind with a growth rate lower than the average among peers in the Industrials sector.
Net Margin: Kadant's financial strength is reflected in its exceptional net margin, which exceeds industry averages. With a remarkable net margin of 10.25%, the company showcases strong profitability and effective cost management.
Return on Equity (ROE): Kadant's ROE surpasses industry standards, highlighting the company's exceptional financial performance. With an impressive 2.9% ROE, the company effectively utilizes shareholder equity capital.
Return on Assets (ROA): Kadant's ROA surpasses industry standards, highlighting the company's exceptional financial performance. With an impressive 1.79% ROA, the company effectively utilizes its assets for optimal returns.
Debt Management: Kadant's debt-to-equity ratio is below the industry average. With a ratio of 0.27, the company relies less on debt financing, maintaining a healthier balance between debt and equity, which can be viewed positively by investors.
To track all earnings releases for Kadant visit their earnings calendar on our site.
This article was generated by Benzinga's automated content engine and reviewed by an editor.
推荐文章
港股周报 | 中国大模型“春节档”打响!智谱周涨超138%;巨亏超230亿!美团周内重挫超10%

一周财经日历 | 港美股迎“春节+总统日”双假期!万亿零售巨头沃尔玛将发财报
一周IPO | 赚钱效应持续火热!年内24只上市新股“0”破发;“图模融合第一股”海致科技首日飙涨逾242%
从软件到房地产,美国多板块陷入AI恐慌抛售潮
Meta计划为智能眼镜添加人脸识别技术
危机四伏,市场却似乎毫不在意
美股机会日报 | 降息预期升温!美国1月CPI年率创去年5月来新低;净利、指引双超预期!应用材料盘前涨超10%
财报前瞻 | 英伟达Q4财报放榜在即!高盛、瑞银预计将大超预期,两大关键催化将带来意外惊喜?
