热门资讯> 正文
The Insider Report: Are Bears Getting Ready to Hibernate?
2025-10-19 21:04
Market Overview
It was one of the most tense weeks in markets in months. Despite all the noise, stocks finished higher across the board, with the Nasdaq leading to the upside. The tech-heavy index closed up 2.14%, while the S&P 500 finished up 1.70% and the Dow Jones Industrial Average up 1.56%. Precious metals hit new record highs, but odds are mounting that the blow off top is complete. Meanwhile, there appears to be a tremendous dip buying opportunity in crypto. There was a lot of fuss about volatility but it could have corresponded to a complete momentum and sentiment reset. Get ready for some real fireworks.
Stocks I Like
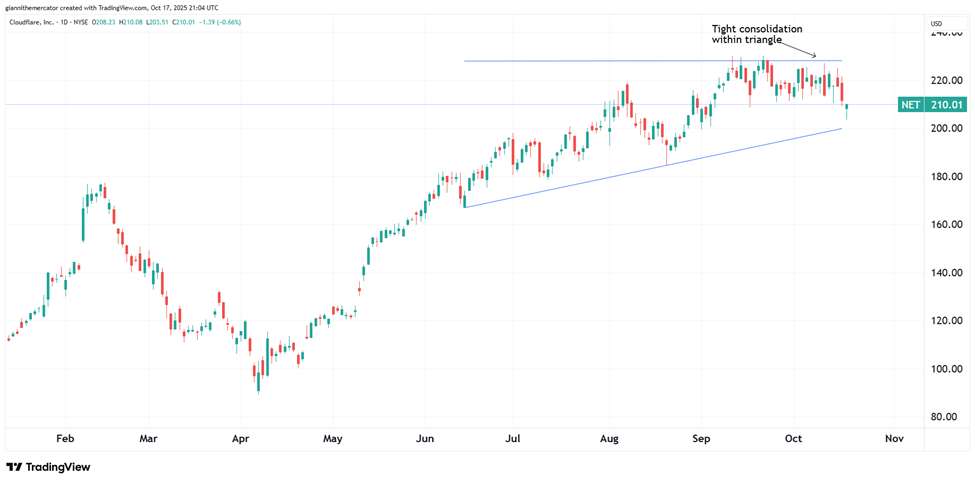
Cloudfare (NET) – 81% Return Potential
What's Happening
- Cloudflare, Inc. (NET) is a leading connectivity cloud company providing cybersecurity, performance, and infrastructure solutions for websites, apps, and APIs, offering investors exposure to the rapidly growing cloud security and digital infrastructure sector with a focus on scalable, secure, and reliable internet services.
- The recent quarterly report showed revenue of $512.32 million and earnings of $75.06 million.
- This valuation on NET is steep. Price-to-Sales is at 40.80, EV to EBITDA is at 1,433 and Book Value is just 3.55.
- At a technical level, NET is consolidating tightly within an ascending triangle formation. These patterns point to a continuation in the trend, which is up.
Why It's Happening
- Cloudflare Inc. is fueling the AI revolution with its Workers platform, driving explosive adoption among developers building intelligent applications. The company’s AI initiatives secured multiple large enterprise deals in Q2 2025, highlighting its role as a foundational enabler for the next wave of digital innovation and positioning Cloudflare at the heart of the multi-trillion-dollar AI economy.
- Launch of the NET Dollar stablecoin marks a bold evolution in Cloudflare’s ecosystem, designed to power seamless machine-to-machine payments in an AI-driven internet. This innovative step bridges cloud infrastructure with fintech, unlocking new revenue streams from automated transactions and reinforcing the narrative of Cloudflare as a forward-thinking pioneer reshaping global commerce.
- Enterprise momentum and customer expansion underscore Cloudflare’s deepening penetration into high-value markets. With 219 new large clients added in Q2 2025 and a growing roster of Fortune 500 companies relying on its services, the company is building a sticky, high-margin customer base that sustains long-term growth amid rising demand for secure, performant cloud solutions.
- Strategic partnerships like the Oracle integration amplify Cloudflare’s multi-cloud dominance. By embedding its connectivity cloud directly into Oracle Cloud Infrastructure, the company empowers joint customers with faster, more secure applications across hybrid environments, creating a compelling story of interoperability that attracts enterprises navigating complex IT landscapes.
- Robust revenue trajectory and profitability progress paint a picture of sustainable scaling. Q2 2025 revenue soared 28% year-over-year to $512.3 million, with full-year guidance pointing to 27% growth, as Cloudflare transitions toward cash flow positivity—bolstering its reputation as a resilient growth engine in the cybersecurity and cloud sectors.
- Analyst Ratings:
- Citigroup: Buy
- Scotiabank: Sector Perform
- Mizuho: Outperform
My Action Plan (81% Return Potential)
- I am bullish on NET above $188.00-$190.00. My upside target is $380.00-$390.00.
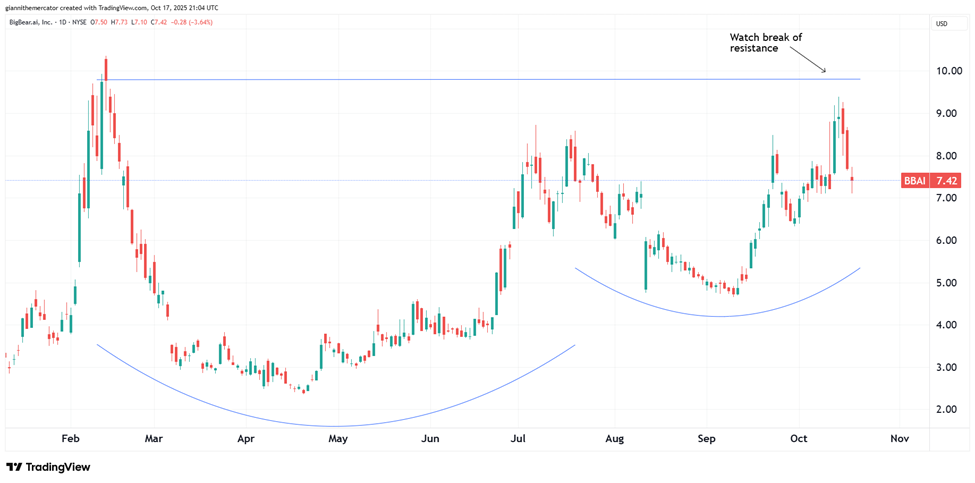
BigBear.ai Holdings (BBAI) – 129% Return Potential
What's Happening
- BigBear.ai Holdings, Inc. (BBAI) is a leading provider of AI-powered decision intelligence solutions, focusing on national security, supply chain management, and digital identity, offering investors exposure to the rapidly growing artificial intelligence and analytics sector with a focus on mission-critical applications for defense and commercial markets.
- The most recent quarterly report showed revenue at $32.47 million but a loss of $228.62 million.
- Valuation is steep here. Price-to-Sales is 15.88 and Book Value is 0.72.
- From a technical standpoint, BBAI is shaping up nicely within a huge cup and handle formation, which points to an acceleration in upside momentum if prices break above resistance.
Why It's Happening
- BigBear.ai Holdings Inc. is capitalizing on the surging demand for AI in national security, with high-profile partnerships driving its growth narrative. Its collaboration with SMX for the U.S. Navy's UNITAS 2025 exercise, deploying AI-powered sensor fusion and domain-awareness tools on unmanned vehicles, positions the company as a key player in enhancing maritime operations for allied forces, tapping into the multi-billion-dollar defense AI market.
- Strategic alliance with Tsecond is a game-changer for battlefield AI deployment. Announced on October 13, 2025, this partnership integrates BigBear.ai's ConductorOS with Tsecond's BRYCK platform to deliver AI-enabled edge infrastructure for mission-critical operations, addressing the growing need for real-time, tactical decision-making in national security—a move that strengthens its reputation as a mission-ready AI innovator.
- Expanding government contract portfolio bolsters BigBear.ai's long-term stability. A $165.15 million U.S. Army contract for global force management, alongside earlier 2025 wins like a $13.2 million DoD deal for its ORION platform, underscores the company's ability to secure high-value, multi-year deals, creating a robust backlog that supports revenue visibility in the defense sector.
- International ambitions and branding initiatives enhance BigBear.ai's global presence. Plans to convert successful pilots into enduring programs abroad, coupled with high-visibility moves like securing naming rights for the Washington Commanders' facility, signal a bold strategy to elevate its brand and expand into new markets, reinforcing its story as an AI leader with far-reaching potential.
- Market momentum and investor enthusiasm fuel BigBear.ai's breakout narrative. With an 85% year-to-date stock surge to $8.57 by October 14, 2025, as shown in the finance card above, and a 412% gain over the past 12 months, the company is riding a wave of optimism around its defense AI advancements, positioning it as a compelling growth story despite near-term financial challenges.
- Analyst Ratings:
- HC Wainwright: Buy
- Cantor Fitzgerald: Overweight
My Action Plan (129% Return Potential)
- I am bullish on BBAI above $6.80-$7.00. My upside target is $17.00-$18.00.
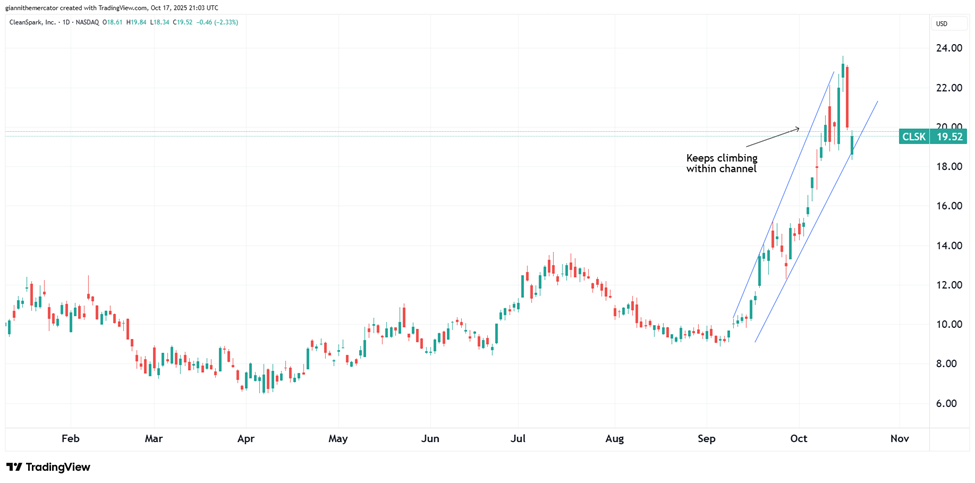
CleanSpark (CLSK) – 95% Return Potential
What's Happening
- CleanSpark, Inc. (CLSK) is a leading bitcoin mining and high-performance computing company, leveraging sustainable energy solutions to power its data centers, offering investors exposure to the rapidly growing cryptocurrency mining and digital infrastructure sector with a focus on efficiency and environmental responsibility.
- CLSK showed revenue of $198.64 million and earnings of $257.14 million in the latest quarter.
- Valuation in CLSK is pretty solid. P/E is at 23.30, Price-to-Sales is at 9.46, and EV to EBITDA is at 8.84.
- From a technical point of view, CLSK is climbing within the ascending price channel. As long as it stays within there, the trend remains up.
Why It's Happening
- CleanSpark Inc. is capitalizing on the Bitcoin market’s resurgence, boosting its treasury to over 13,000 BTC with a 27% year-over-year increase in monthly production as of September 2025. This growth, paired with a 90.81% revenue surge to $198.64 million in Q3 2025, positions the company as a leader in the crypto mining boom, driven by rising institutional adoption and favorable Bitcoin price trends.
- Strategic pivot into high-performance computing (HPC) diversifies CleanSpark's growth narrative. By leveraging its Georgia data centers, including a tier 4 facility, for potential HPC and hybrid Bitcoin mining models, the company is tapping into the multi-trillion-dollar AI infrastructure market, creating a compelling story of transitioning from a crypto pure-play to a broader tech innovator.
- Robust financial flexibility fuels CleanSpark's expansion ambitions. The $400 million Bitcoin-backed credit facility, expanded by $100 million with Two Prime in September 2025, provides non-dilutive capital for scaling data centers and enhancing mining efficiency, reinforcing its ability to seize opportunities in both crypto and HPC without diluting shareholder value.
- Acquisition of GRIID Infrastructure strengthens CleanSpark's operational footprint and sustainability edge. The addition of Tennessee mining sites powered by the Tennessee Valley Authority's clean energy mix aligns with growing ESG priorities, enhancing its appeal to environmentally conscious investors and positioning it as a forward-thinking player in the energy-intensive mining sector.
My Action Plan (95% Return Potential)
- I am bullish on CLSK above $17.00-$18.00. My upside target is $38.00-$40.00.
Market-Moving Catalysts for the Week Ahead
Can You Feel the Tension in the Air?
All it took was a one day drop. We got the momentum reset. Fear is the predominant emotion in the tape right now, and all it took was a major misunderstanding about trade negotiations with China in order to cause this major shift.
I always like to say that sentiment follows price, not the other way around. Stocks are a week off the all-time high, and we haven't even hit a new low in prices yet. Even so, the number of bears climbed significantly across various sentiment surveys.
This creates a perfect backdrop for the market to complete another low. Remember that there are bullish seasonal factors coming into play now as well. It's a pretty good combination of factors that are pointing to another reversal and a rally back to new all-time highs sooner than later.
Government Shutdown – Buy the Rumor, Sell the News?
We're going on more than two weeks so far on this government shutdown, and it doesn't seem like much progress is happening. Historical cases of government shutdowns have been generally bullish for stocks, but it's good to bring up the 2018 example.
Granted, 2018 was a mid-term year, and we're not in one now. But Trump was president then too, and it coincided with a sharp correction into the infamous Christmas Eve low of 2018. This then kickstarted a soaring market into 2019.
Does this same script play out this time? It never follows it exactly. All we can do is focus on the strongest stocks in the strongest sectors, and focus on managing risk. Don't worry so much about selling the absolute high or buying the absolute low.
Sector & Industry Strength
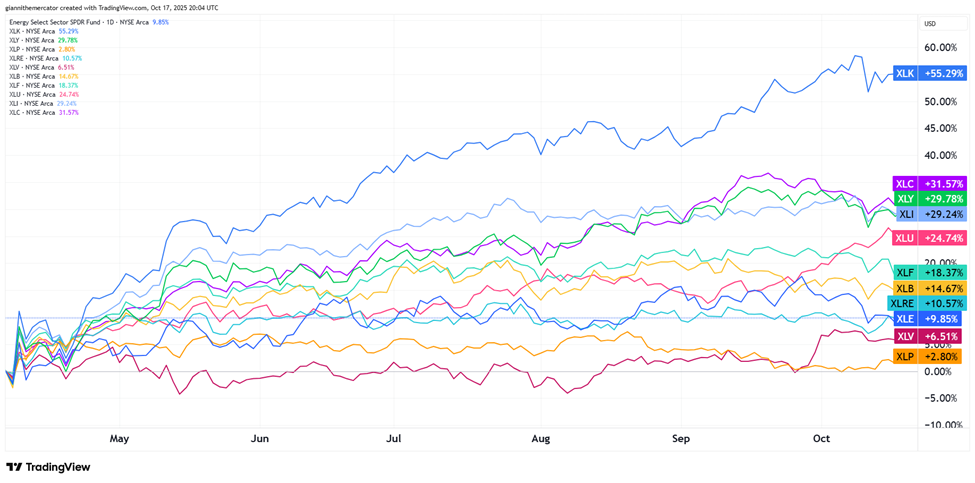
There is so much noise in the tape right now, it's truly remarkable. But when we zoom out and look at the money flows, we don't see any significant changes in the tape. In other words, bears aren't asserting themselves, which begs the question – is this a giant overreaction?
Technology (XLK) is still, by far and away, the top performing sector going back to the April lows. In fact, the only real change from last week is that real estate (XLRE) overtook energy (XLE) in terms of performance from April. The only signal that represents is rates going lower.
If anything, lower rates should be a tailwind for the tech sector (XLK) and consumer discretionary (XLY). All of this price action just seems like a giant rotation, and for those that are overleveraged, it's very painful.
| 1 week | 3 Weeks | 13 Weeks | 26 Weeks |
| Real Estate | Utilities | Utilities | Technology |
Editor's Note: Real estate popping into one-week leader signals lower rates are on the horizon.
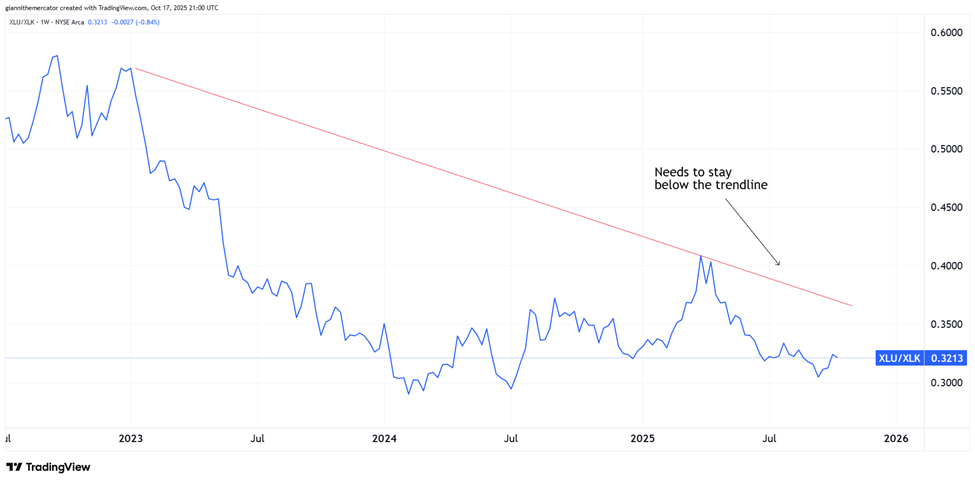
Do We Need the Power or the Tech More? (Sector ETF: XLU/XLK)
Power and nuclear stocks have become the talk of the trading town in recent weeks, as the utilities (XLU) sector is neck and neck against the tech sector (XLK) in terms of outperformance year-to-date.
The consequences of this are profound, because utilities outperforming often signals that downside risks are creeping into the market. At least, this was the traditional read on this money flow. Could it have evolved to adapt to the modern AI economy? It's a conversation worth having.
Fortunately for bulls, the trend in this ratio is still very much in favor of technology (XLK), as seen by the series of lower-lows and lower-highs. As long as this ratio stays below the downward sloping trendline, I'll continue to favor tech over utilities.
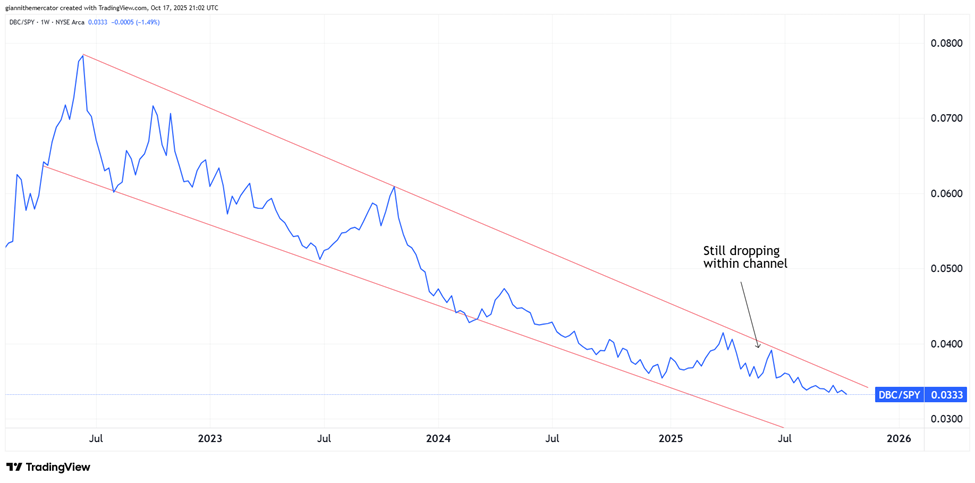
Commodities Still Asleep (Sector ETF: DBC/SPY)
With more rate cuts coming, it's more important than ever to keep a close watch on the commodities (DBC) sector, especially compared against the S&P 500 (SPY). This is a key ratio to watch when it comes to inflationary momentum.
Basically, when DBC is outperforming SPY and the ratio is rising, it means that inflationary pressures are accelerating to the upside. You can still have inflation when this ratio is falling, but it won't be accelerating.
This is exactly what we've had lately – disinflation. When inflation is not accelerating, but still present, stocks offer the best refuge to protect and even grow your wealth, but when inflation starts running hot again, stocks turn volatile and it's important to hide in commodities.
Liquidity Set to Improve Even More (Sector ETF: LQD/IEI)
Fed Chair Powell gave us a pretty big signal last week when he said the end of Quantitative Tightening (QT) was here. Bond markets have been holding up pretty well, and it's important to remember that the first rate cut technically happened in the summer of 2024.
It's time to check back in on the ratio between investment-grade corporate debt (LQD) and 3-7 Year Treasuries (IEI). As a reminder, we want to see LQD outperforming IEI – it signals that markets are willing to avoid the "safety" of Treasuries and reward risk-taking.
I've been tracking the rounding bottom formation in this chart for a couple of years now. The fact that it's been going on so long suggests that a monumental move will come out of this breakout. We just need to close above the upper horizontal trendline acting as resistance.
My Take:
When liquidity conditions improve, you're just not going to get big market crashes. Yes, you'll get quick, sharp reversals that don't last, but most of the time, the declines are very slow and drawn out.
This is why I'm so excited about the recent volatility. It shook out the excess leverage, it reset sentiment, and now, we're seeing the right leadership come out of this low. It looks like seasonality is going to start taking over here soon too, which should be bullish.
Cryptocurrency
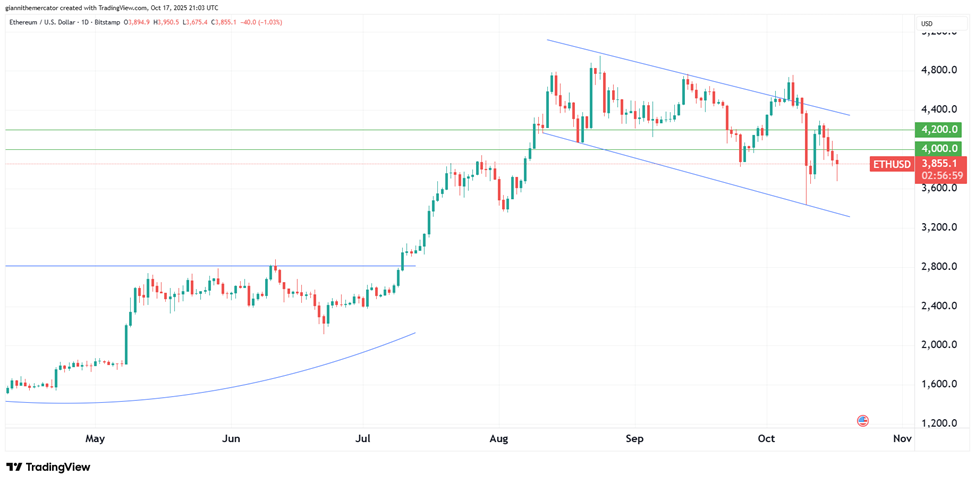
Time to have another look at Ethereum. It's crazy to think that this cryptocurrency has been correcting from its all-time high for the past two months. Prices dropped to a multi-month low a couple weeks back, but held support nicely in the 3300-3400 zone.
Prices are back in the 4000-4200 zone. This is resistance near-term, but the more we see Ethereum test this zone, the more likely it is to break. Despite the lower-lows and lower-highs over the past couple months, I'm most keen on Ethereum holding above the August 3 low at 3355.
I'm eyeing the descending price channel setup on Ethereum's chart. This is a continuation pattern, and if we see a rally back above the upper trendline of the channel, it would signal that a rally up to 5700-5800 is starting.
Legal Disclosures:
This communication is provided for information purposes only.
This communication has been prepared based upon information, including market prices, data and other information, from sources believed to be reliable, but Benzinga does not warrant its completeness or accuracy except with respect to any disclosures relative to Benzinga and/or its affiliates and an analyst’s involvement with any company (or security, other financial product or other asset class) that may be the subject of this communication. Any opinions and estimates constitute our judgment as of the date of this material and are subject to change without notice. Past performance is not indicative of future results. This communication is not intended as an offer or solicitation for the purchase or sale of any financial instrument. Benzinga does not provide individually tailored investment advice. Any opinions and recommendations herein do not take into account individual client circumstances, objectives, or needs and are not intended as recommendations of particular securities, financial instruments or strategies to particular clients. You must make your own independent decisions regarding any securities, financial instruments or strategies mentioned or related to the information herein. Periodic updates may be provided on companies, issuers or industries based on specific developments or announcements, market conditions or any other publicly available information. However, Benzinga may be restricted from updating information contained in this communication for regulatory or other reasons. Clients should contact analysts and execute transactions through a Benzinga subsidiary or affiliate in their home jurisdiction unless governing law permits otherwise.
This communication may not be redistributed or retransmitted, in whole or in part, or in any form or manner, without the express written consent of Benzinga. Any unauthorized use or disclosure is prohibited. Receipt and review of this information constitutes your agreement not to redistribute or retransmit the contents and information contained in this communication without first obtaining express permission from an authorized officer of Benzinga. Copyright 2022 Benzinga. All rights reserved.
推荐文章
华盛早报 | 非农数据大超预期!首次降息或延至7月;AI恐慌交易蔓延至房地产服务板块, CBRE暴跌12%;智谱发布新模型

美股机会日报 | 经济数据强劲!美国1月非农就业大超预期,纳指期货涨至0.6%;AI应用股业绩超预期,Shopify涨超10%
资金复盘 | 北水净买入港股超48亿港元,逾7亿港元抢筹腾讯
华盛早报 | “AI威胁”波及华尔街!财富管理公司全线暴跌;豆包官宣“参战”!春节AI红包战愈演愈烈
美股机会日报 | 科技巨头迎利好?特朗普政府拟结构性豁免芯片关税;台积电1月销售额创历史新高,盘前股价涨近3%
一图看懂 | 净利大增60.7%!中芯国际Q4营收24.9亿美元,同比增长12.8%
美股机会日报 | 市场风格趋变?美银称接下来是小盘股的天下;金价重回5000美元上方,贵金属板块盘前齐升
高盛预计英伟达Q4营收达673亿美元 给出250美元目标股价
