热门资讯> 正文
Bitcoin, Ethereum ETFs Bleed $755 Million, But Technical Analysis Gives Bulls Hope
2025-10-14 21:37
Bitcoin (CRYPTO: BTC) and Ethereum (CRYPTO: ETH) ETFs saw a combined outflow of $755 million, though technical indicators still show resilience, hinting the market may not be as weak as flows suggest.
Bitcoin ETF Outflows Accelerate But BlackRock's IBIT Defies the Trend

US BTC Spot ETF (Source: SoSoValue)
According to data from SoSoValue, U.S. Bitcoin ETFs saw combined outflows of $326 million on Oct. 13.
Grayscale's (NYSE:GBTC) recorded redemptions of $145 million, while Fidelity's (BATS:FBTC) and Ark's (S: ARKB) lost $93 million and $211 million, respectively.
BlackRock's (NASDAQ:IBIT) remained the outlier, drawing $60 million in inflows and holding net assets of about $93 billion.
Cumulative inflows for all U.S. Bitcoin ETFs remain above $62.4 billion, showing continued long-term institutional participation despite short-term volatility.
Ethereum ETFs Face $428M Blow As Institutional Support Wavers

US ETH Spot ETF (Source: SoSoValue)
Ethereum ETFs faced heavier selling pressure, recording $428 million in daily outflows.
BlackRock's (NASDAQ:ETHA) led with $310 million in redemptions, followed by Grayscale's (NYSE:ETHE) with $21 million.
Total ETF assets now stand near $28.7 billion, representing about 5.56% of Ethereum's market capitalization.
The imbalance highlights Bitcoin's deeper institutional base compared with Ethereum's more fragile investor positioning.
Bitcoin Price Holds $111,000 Support As Ascending Channel Stays Intact
BTC Technical Analysis (Source: TradingView)
On the daily chart, Bitcoin dropped to $111,500 after failing to reclaim resistance near $116,000, where the 20-day and 50-day EMAs are aligned.
Despite the decline, Bitcoin continues to respect its ascending trendline from April, with $111,000 acting as a short-term support level and the 200-day EMA near $108,000 serving as a secondary floor.
Unless price closes below $108,000, the larger structure remains intact, keeping the upper projection near $128,000 valid.
The Supertrend indicator shows resistance near $124,500, aligning with the upper channel boundary.
A move above that level would confirm a continuation higher, while a drop below $111,000 would risk a deeper pullback toward the 200-day EMA.
Ethereum Price Defends $3,900 Despite Heavy Redemptions
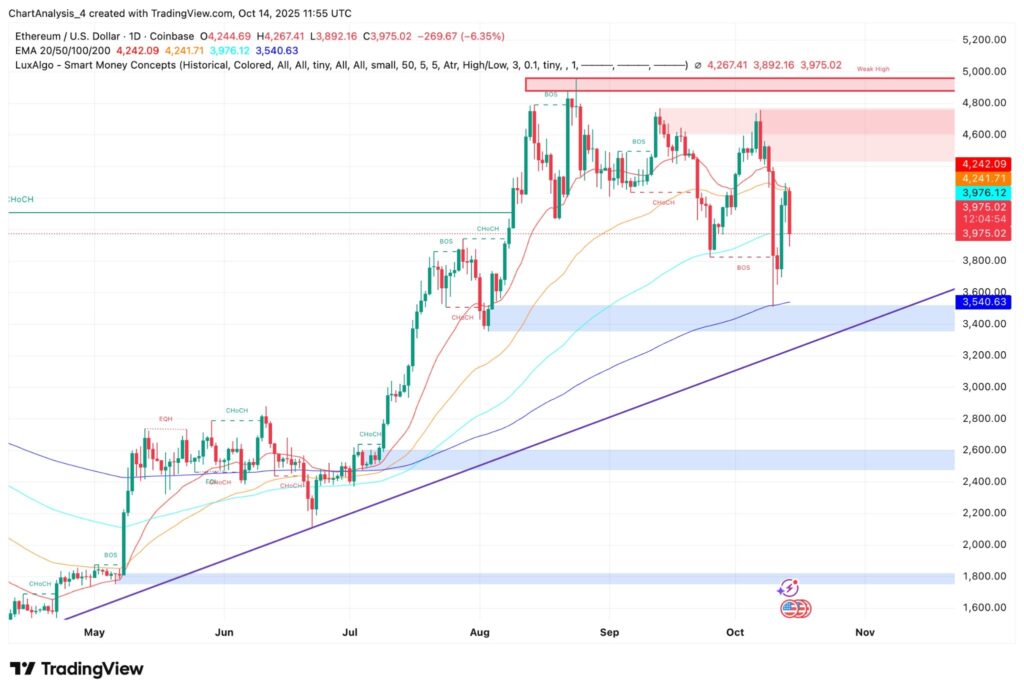
ETH Price Dynamics (Source: TradingView)
Ethereum fell to $3,975 after failing to sustain momentum above the $4,600–$4,800 resistance range.
The correction coincided with heavy ETF outflows, intensifying short-term weakness.
Price continues to defend its ascending trendline, with the 200-day EMA near $3,540 marking the critical support for the broader bullish structure.
Momentum indicators show compression rather than breakdown, with the RSI stabilizing and the MACD flattening.
If Ethereum holds above $3,900–$3,600, the setup favors a rebound toward $4,250–$4,600.
A break below $3,540 would invalidate this pattern and expose deeper downside risk toward $3,200.
ETF Outflows Clash With Bullish Chart Patterns In BTC And ETH
Despite the steep ETF outflows, both Bitcoin and Ethereum continue to trade within longer-term bullish formations.
The divergence between institutional flows and technical structure suggests the outflows may reflect short-term repositioning rather than a breakdown in market confidence.
For Bitcoin, maintaining $108,000–$111,000 keeps the path toward $128,000 open.
For Ethereum, staying above $3,600 is essential for any near-term recovery.
The combination of weakening ETF flows and intact trendlines points to a potential sentiment-driven flush rather than a fundamental shift in market positioning.
Read next:
- Top 2 Energy Stocks That Could Sink Your Portfolio This Month
Image: Shutterstock
推荐文章
港股周报 | 中国大模型“春节档”打响!智谱周涨超138%;巨亏超230亿!美团周内重挫超10%

一周财经日历 | 港美股迎“春节+总统日”双假期!万亿零售巨头沃尔玛将发财报
一周IPO | 赚钱效应持续火热!年内24只上市新股“0”破发;“图模融合第一股”海致科技首日飙涨逾242%
从软件到房地产,美国多板块陷入AI恐慌抛售潮
Meta计划为智能眼镜添加人脸识别技术
危机四伏,市场却似乎毫不在意
美股机会日报 | 降息预期升温!美国1月CPI年率创去年5月来新低;净利、指引双超预期!应用材料盘前涨超10%
财报前瞻 | 英伟达Q4财报放榜在即!高盛、瑞银预计将大超预期,两大关键催化将带来意外惊喜?
