热门资讯> 正文
Trading FuelCell Stock? Here's Why A Pull Back May Be Healthy
2022-05-05 23:49
FuelCell Energy, Inc (NASDAQ:FCEL) was trading more than 9% lower on Thursday, despite printing a bullish Marubozu candlestick on Wednesday, which suggested the stock should trade higher.
The big move in the general markets on Wednesday, caused by a bullish reaction to the Federal Reserve’s decision to raise interest rates by .5bps to combat soaring inflation, may have been a bull trap.
On Thursday, the S&P 500 opened lower and by press time had declined about 3.3%, pressuring individual securities to the downside. FuelCell didn’t fall below Thursday’s low-of-day, however, which has caused the stock to print an inside bar on the daily chart.
An inside bar pattern indicates a period of consolidation and is usually followed by a continuation move in the direction of the current trend.
An inside bar pattern has more validity on larger time frames (four-hour chart or larger). The pattern has a minimum of two candlesticks and consists of a mother bar (the first candlestick in the pattern) followed by one or more subsequent candles. The subsequent candle(s) must be completely inside the range of the mother bar and each is called an "inside bar."
A double, or triple inside bar can be more powerful than a single inside bar. After the break of an inside bar pattern, traders want to watch for high volume for confirmation the pattern was recognized.
- Bullish traders will want to search for inside bar patterns on stocks that are in an uptrend. Some traders may take a position during the inside bar prior to the break while other aggressive traders will take a position after the break of the pattern.
- For bearish traders, finding an inside bar pattern on a stock that's in a downtrend will be key. Like bullish traders, bears have two options of where to take a position to play the break of the pattern. For bearish traders, the pattern is invalidated if the stock rises above the highest range of the mother candle.
Want direct analysis? Find me in the BZ Pro lounge! Click here for a free trial.
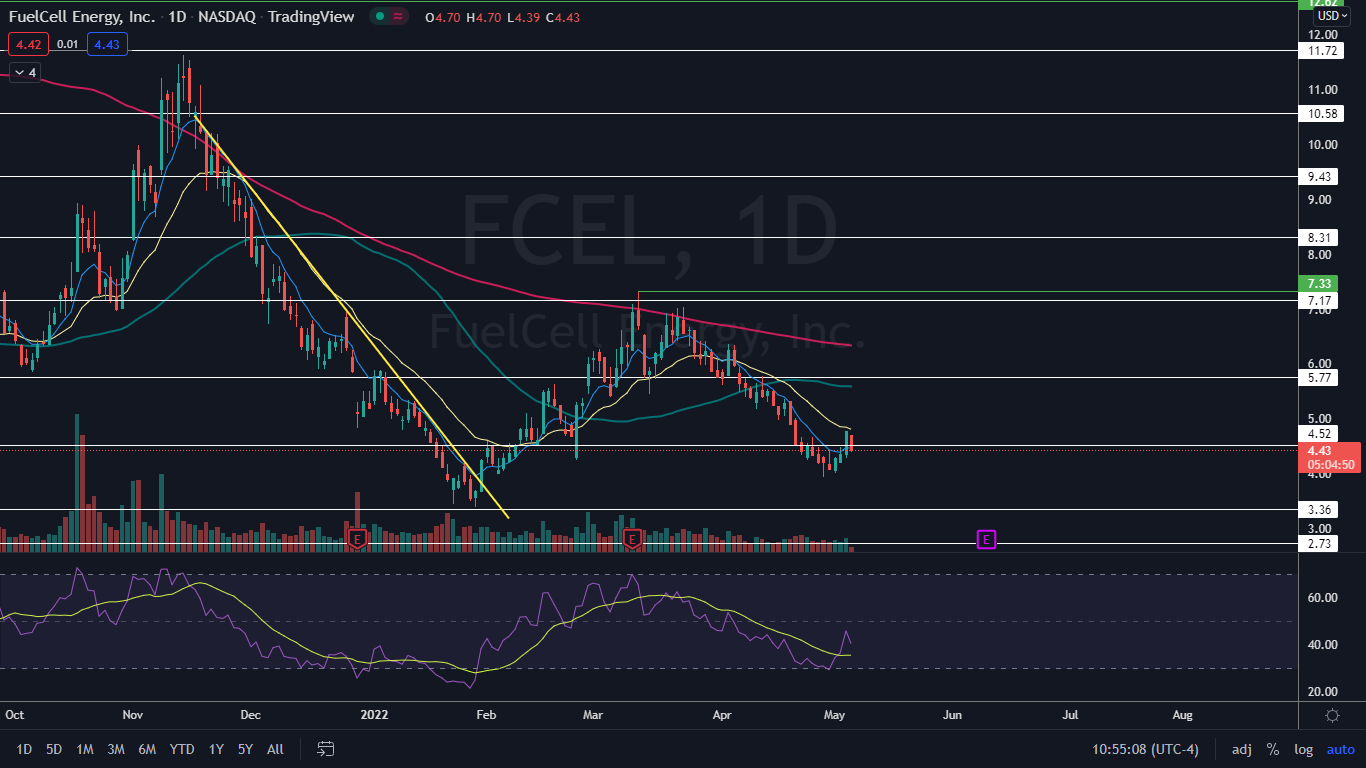
The FuelCell Chart: FuelCell’s inside bar leans bullish because the stock was trading higher in an uptrend before forming the pattern. FuelCell’s most recent higher low was printed May 2 at the $4.02 level and the most recent higher high was formed at $4.77 on Wednesday.
- The inside bar was being created on lower-than-average volume, which is typical of the pattern and validates that consolidation is taking place. At press time, about 400 million FuelCell shares had been exchanged had compared to the 10-day average of 11.96 million.
- Traders can watch for a break up or down from Wednesday’s mother bar to take place on higher-than-average volume later on Thursday or on Friday, to confirm whether the pattern was recognized.
- On Thursday, FuelCell was testing the eight-day exponential moving average (EMA) as support and holding above the level. Bullish traders will want to see this continue and then for big bullish volume to come in and break FuelCell up from the inside bar, which could provide the stock the power need to regain the 21-day EMA as support.
- Bearish traders want to see FuelCell lose support at the eight-day EMA and break down from the mother bar, which could cause the stock to fall below the most recent higher low and negate the uptrend.
- FuelCell has resistance above at $4.52 and $5.77 and support below at $3.36 and $1.69.
See Also: This Company Has Big Plans for Innovation, Steers Smart Solar Technologies Toward EV-Charging Mobility
推荐文章
港股周报 | 中国大模型“春节档”打响!智谱周涨超138%;巨亏超230亿!美团周内重挫超10%

一周财经日历 | 港美股迎“春节+总统日”双假期!万亿零售巨头沃尔玛将发财报
一周IPO | 赚钱效应持续火热!年内24只上市新股“0”破发;“图模融合第一股”海致科技首日飙涨逾242%
从软件到房地产,美国多板块陷入AI恐慌抛售潮
Meta计划为智能眼镜添加人脸识别技术
危机四伏,市场却似乎毫不在意
美股机会日报 | 降息预期升温!美国1月CPI年率创去年5月来新低;净利、指引双超预期!应用材料盘前涨超10%
财报前瞻 | 英伟达Q4财报放榜在即!高盛、瑞银预计将大超预期,两大关键催化将带来意外惊喜?
