热门资讯> 正文
AGNC Investment 2019年第三季度和2019年11月10日BV预测(包括NLY BV预测)
2019-10-15 05:35
I am projecting AGNC will report a relatively unchanged quarterly BV for the third quarter of 2019. Most agency peers should experience a fairly similar fluctuation.
This projection is due to severe valuation losses within AGNC’s derivatives portfolio which were offset by modest-notable net price increases in most fixed-rate agency MBS coupons.
When compared to the second quarter of 2019, a more “muted”/slightly positive relationship existed between MBS pricing and derivative instrument valuations during the third quarter (decrease in spread/basis risk).
However, readers should also understand a more negative relationship between MBS pricing and derivative instrument valuations has occurred during October 2019 (through 10/11/2019). BVs are likely slightly lower versus 9/30/2019.
My projections for AGNC’s BV per common share as of 9/30/2019 and 10/11/2019 are stated in the “Conclusions Drawn” section of the article.
The focus of this article is to provide a detailed projection of AGNC Investment Corp.’s (AGNC) book value (“BV”) per common share as of 9/30/2019. Prior to results being provided to the public on 10/30/2019 (via the company’s quarterly press release), I would like to analyze AGNC’s BV as of 9/30/2019 and provide readers a general direction on how I believe this recent quarter has panned out. A previous three-part article I wrote laid the ground works for this BV projection. In that article, I projected/analyzed AGNC’s income statement (technically speaking, the company’s “consolidated statement of comprehensive income”) for the third quarter of 2019. The links to that three-part projection article are provided below:
AGNC Investment's Q3 2019 Income Statement And Earnings Projection - Part 1 (Includes Current Recommendation)
AGNC Investment's Q3 2019 Income Statement And Earnings Preview - Part 3 (Specified Pools To The Rescue)
By understanding the trends that occurred within AGNC’s operations during the third quarter of 2019, one can apply this information to sector peers as well. As such, the discussion/analysis below is not solely applicable to AGNC but to the fixed-rate agency mortgage real estate investment trust (mREIT) sector as a whole. This includes, but is not limited to, the following fixed-rate agency mREIT peers:
;
;
;
;and
Technically speaking, AI’s 2018
was not a REIT per the Internal Revenue Code (“IRC”) but a C-Corporation. However, AI still maintained many
including the type of investments held by the company, similar risk management strategies, and the amount of dividend distributions paid to shareholders. Beginning in 2019, AI has
to a REIT entity per the IRC.
In addition, the following hybrid mREIT companies that I currently cover had at least a modest portion of each company’s investment portfolio in fixed-rate agency MBS (which typically have higher durations):
;
;
;
;
;
;
;and
. As such, the analysis below is not solely applicable to one company but more so the fixed-rate agency/hybrid mREIT sector as a whole.
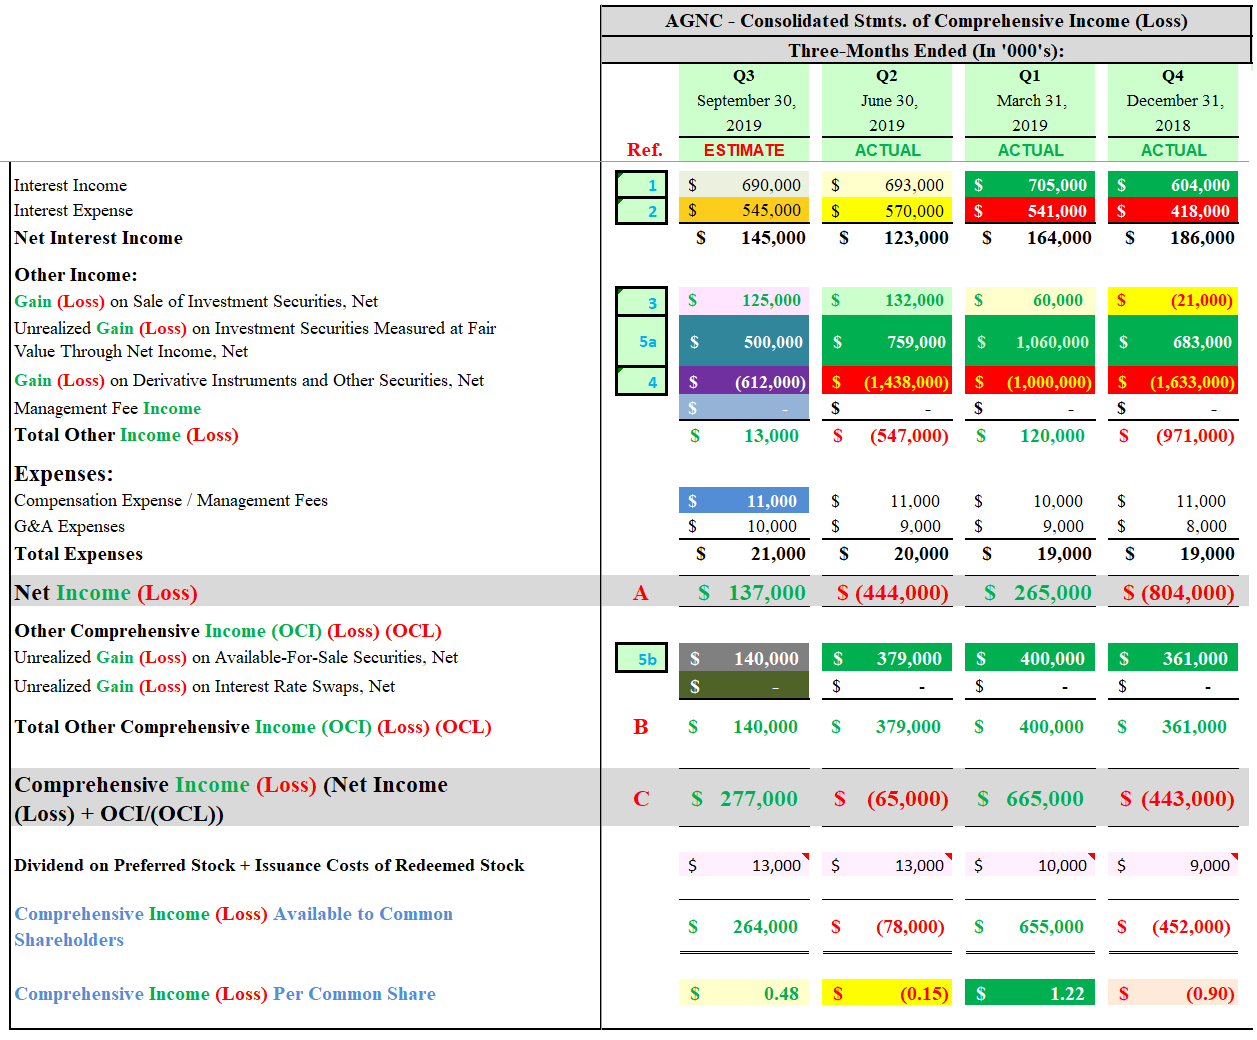
Due to the fact that several figures needed to project/calculate AGNC’s BV, as of 9/30/2019, come directly from the company’s consolidated statements of comprehensive income, Table 1 is provided below. Table 1 shows AGNC’s consolidated statements of comprehensive income from a three months ended time frame. Using Table 1 below as a reference, one must add certain account figures from the first, second, and third quarters of 2019 for purposes of projecting a suitable BV as of 9/30/2019. For comparative purposes, I also include AGNC’s actual results for the fourth quarter of 2018 for additional data/insight for readers.
Table 1 – AGNC Three-Months Ended Consolidated Statements of Comprehensive Income
(Source: Table created by me, partially using data obtained from AGNC's quarterly investor presentation slides)
Having provided Table 1 above, we can now begin to calculate AGNC’s projected BV as of 9/30/2019. This projection will be calculated in Table 2 below. AGNC, through the company’s quarterly investor presentation slides (see link above), only provides the public with a
slide. This specific slide uses information based only on a quarterly time frame. I perform a more detailed quarterly BV calculation/analysis based on the entire calendar year. As such, there is not an identical sheet AGNC provides that matches the data within Table 2.
Table 2 – AGNC Nine-Months Ended BV Projection (BV as of 9/30/2019)
(Source: Table created by me, including all calculated figures and projected valuations)
Using Table 2 above as a reference, unless otherwise noted, all figures are for the
time frame. Let us take a look at the following figures in corresponding order to the “
column shown in Table 2 (next to the September 30, 2019, column):
;
;
; and
This
figure consists of the following amounts that come directly from AGNC’s consolidated statement of comprehensive income (see Tables 1 and 2 above):
;
;
; and
.
Due to the fact I discussed these amounts in my previous three-part AGNC consolidated statement of comprehensive income projection article (see links near the top), further discussion of this figure is redundant/unwarranted.
This
figure consists of the following accounts that come directly from AGNC’s consolidated statement of comprehensive income (see Tables 1 and 2 above):
; and
.
Due to the fact I also discussed these accounts in my previous three-part AGNC consolidated statement of comprehensive income article (see links near the top), further discussion of this figure is redundant/unwarranted as well.
This
figure is AGNC’s dividend distributions for the first, second, and third quarters of 2019. This figure includes activity in relation to the following types of outstanding shares of stock:
; and
.
:
AGNC has the following four events/programs which could impact the number of outstanding shares of common stock the company has when monthly dividends are accounted/accrued for:
;
;
; and
.
AGNC did not have a
issuance of common stock during the first, second, or third quarters of 2019. However, AGNC did use the company’s ATM offering program during the second quarter of 2019 when a total of approximately 11.5 million shares of common stock were issued. For the third quarter of 2019, I am projecting a total of 2.0 million shares of common stock were issued during early August 2019; prior to the mREIT sector’s sell-off later that month which partially reversed course during September 2019. Furthermore, I am assuming there was no notable activity within the company’s dividend reinvestment/direct stock purchase programs during the first, second, or third quarters of 2019.
When it comes to AGNC’s repurchase program, the company intends to buy back outstanding shares of common stock only when the repurchase price is materially accretive to CURRENT tangible BV. This program was created in October 2012 and was amended in October 2016 to allow AGNC to repurchase up to $1 billion of the company’s outstanding shares of common stock through 12/31/2017. This share repurchase plan previously expired and was not “reactivated” until the third quarter of 2019. Due to the aforementioned mREIT sector sell-off in August 2019, AGNC’s Chief Executive Officer (“CEO”) Mr. Gary Kain disclosed during an analyst’s conference presentation management repurchased some common stock during the quarter when its stock price was trading at a material discount to its then CURRENT tangible BV. As such, I am projecting management repurchased (5.0) million shares of common stock during the third quarter of 2019. As such, I am projecting a net reduction of (3.0) million shares of common stock during the third quarter of 2019. This should be considered a “cautious” estimate (more shares could have been repurchased).
The monthly dividends accrued for/declared on AGNC’s common stock for the first, second, and third quarters of 2019 totaled $0.54, $0.50, and $0.48 per share, respectively. Beginning in May 2019, AGNC decreased the company’s monthly common stock dividend from $0.18 to $0.16 per share. When calculated, I am projecting AGNC had dividend distributions to common shareholders of ($262) million for the third quarter of 2019. When this projection is combined with AGNC’s dividend distribution to common shareholders of ($560) million for the first and second quarters of 2019, I am projecting the company had common stock dividend distributions totaling ($822) million for the nine-months ended 9/30/2019. Now, let us project the preferred stock dividend distributions.
:
The dividend accrued for/declared on AGNC’s “Series B Preferred Stock” (AGNCB), “Series C Preferred Stock” (AGNCN), and “Series D Preferred Stock” (AGNCM) for the third quarter of 2019 was $0.484375, $0.4375, and $0.429688 per depository share, respectively. When calculated, I am projecting AGNC had total dividend distributions to AGNCB, AGNCN, and AGNCM shareholders of ($13) million for the third quarter of 2019. When this projection is combined with AGNC’s dividend distributions to preferred shareholders of ($23) million for the first and second quarters of 2019, I am projecting the company had preferred stock dividend distributions totaling ($36) million for the nine-months ended 9/30/2019.
After combining the common and preferred stock dividend distributions for the first, second, and third quarters of 2019, I am projecting AGNC’s total decrease in net common equity from stockholder transactions was ($858) million for the nine-months ended 9/30/2019 (see red reference
in Table 2 above).
As stated earlier, AGNC did not have a bulk issuance of common stock during the first, second, or third quarters of 2019. However, AGNC did use the company’s ATM offering program during the second quarter of 2019 when a total of approximately 11.5 million shares of common stock were issued for net proceeds of approximately $190 million. For the third quarter of 2019, I am projecting 2.0 million shares of common stock were issued during early August 2019 for net proceeds of $33 million.
Since AGNC officially internalized the company’s management structure through its acquisition of American Capital Mortgage Management (“ACMM”) in 2016, management may be partially compensated through the issuance of common stock subject to certain vesting options. As such, AGNC may have some minor amount of equity issuance/capital proceeds through the following accounts:
; and/or
. I have projected a very minor amount of equity was generated from these two sources during the first, second, and third quarters of 2019. This activity should only have, at most, a very minor impact to AGNC’s BV as of 9/30/2019.
Regarding AGNC’s
figure, as stated earlier the company recently disclosed management repurchased some common stock during the third quarter of 2019 when its stock price was trading at a material discount to its then CURRENT tangible BV. As such, I am projecting management repurchased (5.0) million shares of common stock during the third quarter of 2019 at a weighted average price of $15.25 per share. When calculated, this is a projected decrease in equity of ($76) million.
When all of the above figures are combined, I am projecting the company had a
figure of $138 million for the nine-months ended 9/30/2019 (see red reference
in Table 2 above). This is a projected minor net decrease when compared to this figure as of 6/30/2019.
As was highlighted in my three-part AGNC income statement projection article (see links near the top of this article), I discussed several differences between AGNC’s and NLY’s investment portfolio. Beginning several years ago, NLY diversified the company’s investment portfolio by allocating more capital into commercial debt/real estate, preferred equity, corporate debt, residential whole loans, mortgage servicing rights (“MSR”), and middle market (“MM”) lending. NLY’s added diversification should result in reduced volatility during certain interest rate cycles (reduction in duration). In addition, NLY acquired a variable-rate agency mREIT, Hatteras Financial Corp. (HTS) in 2016 and acquired a hybrid mREIT, MTGE Investment Corp. (MTGE) in September 2018.
Generally speaking, most of these asset classes, when compared to most fixed-rate agency MBS coupons (especially specified pools), experienced less favorable price fluctuations during the third quarter of 2019. However, it should also be noted a vast majority of NLY’s investment portfolio still remained in agency MBS when based on FMV (92% as of 6/30/2019).
When looking at each peer’s derivatives portfolio, AGNC and NLY had a hedging coverage ratio of 91% and 74% as of 6/30/2019, respectively. As such, AGNC had more hedges in place when based on notional value which, if all other factors were held constant, would equate to AGNC being more at risk for valuation decreases within this specific portfolio. However, I would point out offsetting AGNC’s higher hedging coverage ratio (since derivatives lost value during the third quarter of 2019) is more of NLY’s hedges were towards the longer-end of the yield curve (higher weighted average tenor/maturity) which offsets their lower hedging coverage ratio. So, when it comes to derivative valuation fluctuations, there were offsetting factors at play this quarter.
As such, I believe AGNC and NLY had a fairly similar type of valuation loss during the third quarter of 2019 when it comes to each company’s derivatives instruments (proportionately speaking). I also believe each company’s net valuation losses within its derivative instruments were near each company’s MBS/investment portfolio’s net valuation gain. As discussed throughout various mREIT articles over the past several months, this is due to the more
/slightly positive relationship that existed between MBS/asset pricing and derivative instrument valuations during the third quarter of 2019 when compared to the prior quarter (decrease in spread/basis risk). After a positive start in July, this specific relationship deteriorated in August but
in September. This was fully covered within the following mREIT article:
Arlington Asset And Cherry Hill Mortgage Investment: MBS Pricing For Q3 2019 (Includes Current BV Projections Amid Volatility)
When taking all quarterly activities into consideration (including additional data not discussed within this specific article), I am projecting NLY will report the following BV per common share as of 9/30/2019:
NLY’s Projected BV as of 9/30/2019 = $9.30 Per Common Share
To sum up all the information discussed above, I am projecting AGNC will report the following BV per common share as of 9/30/2019:
AGNC’s Projected Non-Tangible BV as of 9/30/2019 = $17.55 Per Common Share
This projection is a $0.01 per common share increase from AGNC’s BV as of 6/30/2019. This increase can be attributed to two factors. The first factor is in relation to the activity within AGNC’s consolidated statement of comprehensive income. I am projecting AGNC will report net income of $137 million for the third quarter of 2019 while reporting OCI of $140 million. When both figures are combined, I am projecting AGNC will report comprehensive income of $277 million for the third quarter of 2019.
The second factor is in relation to the activity within AGNC’s equity section of the balance sheet. AGNC accrued for/declared dividend distributions totaling ($0.48) per common share during the third quarter of 2019. In addition, AGNC accrued for/declared dividend distributions in regards to holders of the company’s outstanding shares of preferred stock while also having a slight accretive impact from recent share repurchases.
When combined, these two factors account for a projected quarterly BV net increase of $0.01 per common share. When calculated, I am projecting AGNC’s non-tangible BV per common share had an increase of 0.1% during the third quarter of 2019. I am also projecting AGNC generated an
(dividends accrued for/declared and net change in BV) of 2.8% for the third quarter of 2019. I am projecting AGNC will report the following tangible BV per common share as of 9/30/2019:
AGNC’s Projected Tangible BV as of 9/30/2019 = $16.60 Per Common Share
I believe most agency mREIT peers will report a minor decrease-minor increase in quarterly BV. The same holds true for most hybrid/multipurpose mREIT peers as well. However, it should be noted a more
relationship between MBS pricing and derivative instrument valuations has occurred during the October 2019 (through 10/11/2019).
Through a detailed analysis that will be omitted from this particular article, I am projecting AGNC’s BV as of 10/11/2019 has decreased ($0.35)-($0.05) per common share when compared to the company’s BV as of 9/30/2019.
This projection
excludes
the October 2019 monthly dividend of $0.16 per common share (ex-dividend is 10/29/2019).
From the analysis provided above, including additional catalysts/factors not discussed within this particular article, I currently rate AGNC as a SELL when I believe the company’s stock price is trading at or greater than my projected non-tangible CURRENT BV (BV as of 10/11/2019; $17.35 per share), a HOLD when trading at less than my projected non-tangible CURRENT BV through less than a (10%) discount to my projected non-tangible CURRENT BV, and a BUY when trading at or greater than a (10%) discount to my projected non-tangible CURRENT BV. These ranges are unchanged when compared to my last AGNC article (PART 3 of my income statement projection analysis).
Therefore, I currently rate
AGNC
as a HOLD
since the stock is trading
at less than my projected non-tangible CURRENT BV through less than a (10%) discount to my projected non-tangible CURRENT BV.
As such, I currently believe AGNC is appropriately valued from a stock price perspective (not overvalued, not undervalued).
My current price target for AGNC is approximately $17.35 per share.
This is currently the price where my HOLD recommendation would change to a SELL.
Along with the data presented within this article, this recommendation considers the following mREIT catalysts/factors:
;
; and
The current price where my recommendation would change to a BUY is approximately $15.60 per share.
Along with the data presented within this article, this recommendation considers the following mREIT catalysts/factors:
;
;and
This recommendation also considers the four Federal (“Fed”) Funds Rate increases by the Federal Open Market Committee (“FOMC”) during 2018 (this was a more hawkish tone/rhetoric when compared to most of 2017) and the likely two-three Fed Funds Rate decreases during 2019 due to the recent dovish tone/rhetoric regarding overall monetary policy as a result of recent macroeconomic trends/events. This also considers the wind-down/decrease of the Fed’s balance sheet through gradual runoff/partial non-reinvestment (which began in October 2017 which increased spread/basis risk) and the recent
of this wind-down starting in May 2019 regarding U.S. Treasuries and now August 2019 regarding agency MBS (which should partially reduce spread/basis risk when volatility remains subdued).
Each investor's BUY, SELL, or HOLD decision is based on one's risk tolerance, time horizon, and dividend income goals. My personal recommendation will not fit each reader’s current investing strategy.
The factual information provided within this article is intended to help assist readers when it comes to investing strategies/decisions.
On 1/31/2017, I initiated a position in New Residential Investment Corp. (NRZ) at a weighted average purchase price of $15.10 per share. On 6/29/2017, 7/7/2017, and 12/21/2018, I increased my position in NRZ at a weighted average purchase price of $15.775, $15.18, and $14.475 per share, respectively. When combined, my NRZ position has a weighted average purchase price of $14.912 per share. This weighted average per share price excludes all dividends received/reinvested. Each NRZ trade was disclosed to readers in real time (that day) via the StockTalks feature of Seeking Alpha. I currently have a BUY recommendation on NRZ.
On 6/29/2017, I initiated a position in CHMI at a weighted average purchase price of $18.425 per share. On 10/6/2017, 10/26/2017, 11/6/2017, 1/29/2018, 10/12/2018, 6/6/2019, 7/23/2019, and 9/5/2019, I increased my position in CHMI at a weighted average purchase price of $18.015, $18.245, $17.71, $17.145, $17.235, $16.315, $15.325, and $12.435 per share, respectively. When combined, my CHMI position has a weighted average purchase price of $13.739 per share (yes, my latest purchase was proportionately large). This weighted average per share price excludes all dividends received/reinvested. Each CHMI trade was disclosed to readers in real time (that day) via the StockTalks feature of Seeking Alpha.
I currently have a BUY recommendation on CHMI.
On 8/31/2017, I initiated a position in CHMI’s Series A preferred stock, (CHMI.PA). On 9/12/2017, I increased my position in CHMI-A. When combined, my CHMI-A position has a weighted average purchase price of $25.198 per share. Each CHMI-A trade was disclosed to readers in real time (that day) via the StockTalks feature of Seeking Alpha. I currently have a HOLD recommendation on CHMI.PA.
On 1/29/2018, I initiated a position in TWO at a weighted average purchase price of $15.155 per share. On 4/17/2019, I increased my position in TWO at a weighted average purchase price of $13.165 per share. When combined, my TWO position has a weighted average purchase price of $13.825 per share. This weighted average per share price excludes all dividends received/reinvested. Each TWO trade was disclosed to readers in real time (that day) via the StockTalks feature of Seeking Alpha.
I currently have a HOLD recommendation on TWO.
On 3/8/2018, I initiated a position in New York Mortgage Trust, Inc.’s (NYMT) Series D preferred stock, (NYMTN). On 4/6/2018, 4/27/2018, 10/12/2018, 12/7/2018, 12/18/2018, and 12/21/2018, I increased my position in NYMTN. When combined, my NYMTN position has a weighted average purchase price of $22.379 per share. This weighted average per share price excludes all dividends received/reinvested. Each NYMTN trade was disclosed to readers in real time (that day) via the StockTalks feature of Seeking Alpha. I currently have a HOLD recommendation on NYMTN.
On 10/12/2018, I initiated a position in Granite Point Mortgage Trust, Inc. (GPMT) at a weighted average purchase price of $18.155 per share. This weighted average per share price excludes all dividends received/reinvested. This GPMT trade was disclosed to readers in real time (that day) via the StockTalks feature of Seeking Alpha. I currently have a BUY recommendation on GPMT.
On 10/12/2018, I initiated a position in MITT at a weighted average purchase price of $17.105 per share. On 4/17/2019 and 6/3/2019, I increased my position in MITT at a weighted average purchase price of $16.22 and $15.52 per share, respectively. When combined, my MITT position has a weighted average purchase price of $15.946 per share. This weighted average per share price excludes all dividends received/reinvested. Each MITT trade was disclosed to readers in real time (that day) via the StockTalks feature of Seeking Alpha.
I currently have a BUY recommendation on MITT.
On 6/3/2019, I initiated a position in ARR at a weighted average purchase price of $17.545 per share. On 9/10/2019, I increased my position in ARR at a weighted average purchase price of $16.785 per share. When combined, my ARR position has a weighted average purchase price of $16.975 per share. This weighted average per share price excludes all dividends received/reinvested. This ARR trade was disclosed to readers in real time (that day) via the StockTalks feature of Seeking Alpha.
I currently have a BUY recommendation on ARR.
On 6/3/2019, I initiated a position in IVR at a weighted average purchase price of $15.49 per share. This weighted average per share price excludes all dividends received/reinvested. This IVR trade was disclosed to readers in real time (that day) via the StockTalks feature of Seeking Alpha.
I currently have a BUY recommendation on IVR.
All trades/investments I have performed over the past several years have been disclosed to readers in real time (that day at the latest) via the StockTalks feature of Seeking Alpha (which cannot be changed/altered). Through this resource, readers can look up all my prior disclosures (buys/sells) regarding all companies I cover here at Seeking Alpha (see my profile page for a list of all stocks covered).
Through StockTalk disclosures, at the end of September 2019, I had an unrealized/realized gain
of 84.1% and a total return (includes dividends received) success rate of 97.7% out of 44 total positions (updated monthly; multiple purchases/sales in one stock count as one overall position until fully closed out). I have yet to realize a
in any of my past positions.
Both percentages experienced a minor increase in September due to the partial reversal of the previous sell-off within the mREIT sector; mainly due to a partial easing of fears of narrowing net spreads and higher prepayments. I encourage other Seeking Alpha contributors to provide real time buy and sell updates for their readers which would ultimately lead to greater transparency/credibility.
Final Note: I am currently "teaming up" with Colorado Wealth Management to provide intra-quarter CURRENT BV per share projections on all 21 mREIT stocks I currently cover. This consists of weekly BV projections for all agency mREITs I cover (including AGNC) and monthly BV projections for all hybrid/multipurpose mREITs. I also provide some commentary/overall thoughts on most mREITs' quarterly earnings. These very informative (and “premium”) projections are provided through Colorado's S.A. Marketplace service. In the near future, I plan on expanding my services through this Marketplace service via additional data/analytics, continuous sector recommendation ranges, and exclusive mREIT articles.
I am/we are long ARR, CHMI, CHMI.PA, GPMT, IVR, MITT, NYMTN, NRZ, TWO.
I wrote this article myself, and it expresses my own opinions. I am not receiving compensation for it (other than from Seeking Alpha). I have no business relationship with any company whose stock is mentioned in this article.
Additional disclosure:
I currently have no position in AGNC, AGNCB, AGNCN, AGNCM, AI, CIM, DX, MFA, MORL, MORT, NLY, NYMT, ORC, REM, or WMC.
推荐文章
港股周报 | 中国大模型“春节档”打响!智谱周涨超138%;巨亏超230亿!美团周内重挫超10%

一周财经日历 | 港美股迎“春节+总统日”双假期!万亿零售巨头沃尔玛将发财报
一周IPO | 赚钱效应持续火热!年内24只上市新股“0”破发;“图模融合第一股”海致科技首日飙涨逾242%
从软件到房地产,美国多板块陷入AI恐慌抛售潮
Meta计划为智能眼镜添加人脸识别技术
危机四伏,市场却似乎毫不在意
美股机会日报 | 降息预期升温!美国1月CPI年率创去年5月来新低;净利、指引双超预期!应用材料盘前涨超10%
财报前瞻 | 英伟达Q4财报放榜在即!高盛、瑞银预计将大超预期,两大关键催化将带来意外惊喜?
