热门资讯> 正文
每周回顾:高收益CEF-行业表现积极
2019-08-28 11:07
- Credit Suisse Asset Management Income Fund Inc(CIK) 0
- Ivy High Income Opportunities Fund(IVH) 0
- 保德信短久期高收益基金(ISD) 0
Although the last day was very volatile, the high-yield bonds reported a positive performance on a weekly basis.
We continue to see a strong correlation between the high-yield bonds and the stock market.
Taking into account the high Z-scores of the high-yield, closed-end funds, I am not going to review a fund as a potential long candidate.
The closed-end funds from the high-yield sector significantly increased their prices over the past months. Currently, most of them are traded at positive Z-scores, which is an indication that they have lost most of their statistical edge. Still, they are traded at high discounts, but we are cautious when we select our positions due to the lack of statistical edge. For me, personally, I am in a waiting mode to see a statistical opportunity to review some of the funds.
The last day of the week left most of the riskier assets in negative territory after President Donald Trump ordered that U.S. manufacturers find alternatives to their operations in China. This action came after China announced they will implement new tariffs on another $75 billion worth of U.S. goods. The situation on the market remains very unstable and difficult to be predicted. Taking all of the factors, we may expect increased volatility in the high-yield bonds and high-yield closed-end funds if the situation around the trade war becomes more complicated.
Although the last day was negative, we saw a very good performance from the high-yield bonds earlier in the week. The main benchmark iShares iBoxx $ High Yield Corporate Bond ETF (HYG) increased its price by $0.45 per share and finished the last session at $86.55 per share.
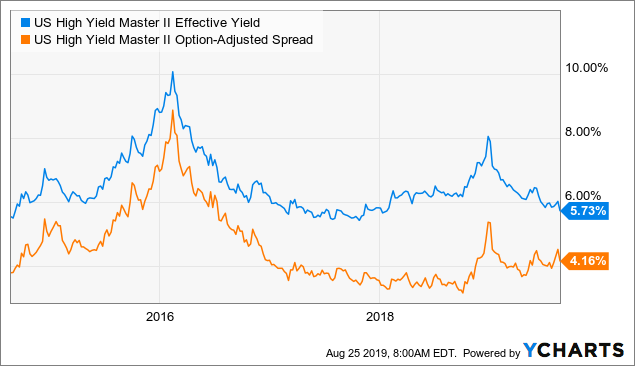
High-yield bonds are typically evaluated on the difference between their yield and the yield on the US Treasury bond. High-yield spreads are used by investors and market analysts to evaluate the overall credit markets. Higher spreads indicate a higher default risk in junk bonds and can be a reflection of the overall corporate economy and/or a broader weakening of macroeconomic conditions. On a weekly basis, we notice a decrease of 0.36 bps.
 Data by YCharts
Below, you can find a statistical comparison between HYG and the iShares 20+ Year Treasury Bond ETF (TLT). We observe a correlation between the two sectors of 0.78 points for the last 200-day period:
On the other hand, we have a statistical comparison between HYG and the SPDR S&P 500 Trust ETF (SPY). There is definitely a stronger relationship between them for the last 150 days. As you see, it is 0.96 points.
Several funds announced their regular dividends:
Weekly % Changes In The Sector
1. Lowest Z-Score
:
The last day of the week was marked by increased volatility and а decrease for the prices of the riskier assets. However, the past week was positive for the closed-end funds which invest in high-yield bonds and most of them reported an increase in their prices and net asset values.
The Z-score metric is very common in finance and statistics. It is one of the main tools which we use when we prepare our research for closed-end funds. It shows us how many times the discount/premium deviates from its mean for a specific period and may be useful to conclude if the fund is overpriced or undervalued from a statistical point of view. Still, many of the funds are traded at positive Z-scores which is a sign that we cannot talk about a statistical edge to include some of them to our portfolio.
PGIM High Yield Bond Fund (ISD) is one of the funds with relatively low Z-score and one of the highest discounts in the sector. This is one of the interesting candidates from the high-yield CEFs. The management team of the fund has increased the dividend in March and the current yield which is offered at that moment is 8.39%. A fact which I consider as positive is the good level of the earnings coverage ratio and positive UNII balance per share.
2.
Highest Z-Score
:
When I see statistically overpriced asset without any significant fundamental reason, I prefer to re-allocate my money in some similar investment with lower Z-score. The closed-end funds with Z-score above 2.00 points may be considered as statistically overpriced from my perspective.
Barings Participation Investors (MPV) is trading at a Z-score of 3.00 points which is a signal to close the long positions. On top of that this fund is traded at a premium of 26.17% which is the highest premium in the sector. Barings Corporate Investors (MCI) seems a very good alternative option as it offers a higher yield and is traded at lower Z-scores and premium.
The average Z-score of the high-yield CEFs is 0.84 points. On a weekly basis, we find an increase of 0.08 bps of the average value. It is pretty interesting to notice the drastic change. At the end of December, we had -3.43 points average Z-score and, now, it is slightly below 1.00 point.
3
.
Biggest Discount
:
The next criterion, which I consider as important, is the spread between the net asset value and the price. No doubt, if you combine the attractive discount with relatively low Z-score, the changes for a capital gain are even higher.
I suppose some of the above funds are traded at a discount just because their latest earnings were not high enough to cover the monthly distribution. A factor which is a concern for most of the market participants due to a potential dividend cut. However, according to CEFConnect, Apollo Tactical Income Fund, Inc. (AIF), New America High Income Fund (HYB) and Ivy High Income Opportunities Fund (IVH) continue to keep earnings/coverage ratio above 100%. In other words, the latest earnings of their portfolios are high enough to maintain the dividend. Therefore, from my perspective, these funds have the quality to be analyzed in more detail.
The average discount/premium of the high-yield CEFs is -6.37%. Last week, the average spread between prices and net asset values was -6.70%.
4.
Highest Premium
:
The two funds sponsored by Babson Capital Management LLC continue to keep their leading positions when we talk about a premium. The recent announcement of the increased net asset values and the solid past performance are the main reasons why market participants pay such prices for them. As I have already mentioned MCI is the better investment decision at the moment.
Here is the full picture of the funds from the sector. Below, we have depicted their discount/premium and their Z-score:
5.
Highest 5-year Annualized Return On NAV
:
Above are the funds that outperformed their peers by return on net asset value for the past five years. The average return on NAV for that period is 4.88% for the sector. As you can see, most of the current yields on price and net asset value are higher than the historical ones. The situation seems justified because, last year, we saw two sharp declines in the prices of the funds.
If I have to mention a fund which can be reviewed as potential "Long" candidate from the above participants, it will be Credit Suisse Asset Management Income Fund (CIK). Currently, it has one of the lowest Z-scores and 9.01% discount. Its current yield is 8.63%, and as we saw, it has one of the best historical returns on its net asset value, which is a sign for the quality management team.
6.
Highest Distribution Rate
:
The average yield on a price for the sector is 8.32%, and the average yield on net asset value is 7.77%. The difference between the two values can be easily explained by the spread between the price and the net asset values of the funds.
7. Lowest Effective Leverage:
We have two funds which are not leveraged and three which use leverage below 10%. The average leverage for the sector is 26.43%. Below, you can see the relationship between the effective leverage of the funds and their yield on net asset value.
The high-yield sector does not provide us with significant arbitrage opportunities at present. Most of the CEFs are trading at discounts, and it is difficult to find so many potential
"Short"
candidates. On the other hand, there are still interesting funds which provide us with an attractive valuation based on the discount, and we can review them as potential
"Buy"
candidates if their Z-scores are not too high. However, we should be careful because the situation on the market seems unstable and the riskier assets such as high-yield bonds CEFs may be affected by the volatility.
I/we have no positions in any stocks mentioned, but may initiate a long position in IVH over the next 72 hours.
I wrote this article myself, and it expresses my own opinions. I am not receiving compensation for it (other than from Seeking Alpha). I have no business relationship with any company whose stock is mentioned in this article.
推荐文章
美股机会日报 | 止跌企稳!纳指期货盘前涨约0.5%,有分析称美股连遭重挫后或回升;亚马逊盘前大跌超8%

一周财经日历 | 事关降息!美国1月非农、CPI数据下周公布;恒指季检结果下周五揭晓
华尔街大多头漫谈黄金“黑天鹅”风险:马斯克实现太空采金,化身全球央行行长
避险情绪席卷市场 华尔街青睐的热门交易纷纷崩跌
华盛早报 | 无一幸免!美股、金银、加密货币与原油集体崩盘;南向资金爆买250亿港元!创约半年来新高;千问APP今日启动30亿免单
亚马逊股价盘后大跌近10%,巨额资本支出引发担忧
比特币暴跌带来124亿美元巨亏 Saylor的金融实验岌岌可危
2月6日外盘头条:比特币暴跌 亚马逊预计今年资本支出将达2000亿美元 交易员料美联储将比预期更早降息
