热门资讯> 正文
绿点投资组合:2019年5月更新
2019-06-05 21:30
Total cash income on portfolio investment for May from dividends and swing trades was +0.95% and has totaled +8.72% for the past 7 months, 50% above my 10% annual goal.
Dividend income for May was $760, (monthly average is $710). Closed-end funds contributed 83% of dividends. Dividends contributed 51% of total portfolio income.
Swing trade income for May was $740. I closed 4 swing trades for a net gain of +7.8% (average 27 days), and 2 for a total loss of -5%.
In May, the SPY pulled back -6.4% following 4 months of gains. Financials and small caps are now far from retracing the 2018 bear market.
I am considering making changes to my portfolio reporting.
Welcome to my May update for my Green Dot Portfolio, a small self-directed retirement portfolio created in a Roth IRA trading account.
May was the seventh month of my second year for my portfolio, and it was another month of cash income above that needed to make my annual goal. This year my goal is to achieve 10%+ in total cash income, using high-yield dividend investments (closed-end funds, REITs, and dividend growth stocks), as well as swing- and position-trading of stocks, ETFs, and some option premiums.
Readers of my previous updates know that I use the broad market index, the
SPDR S&P 500 Trust ETF
(
SPY
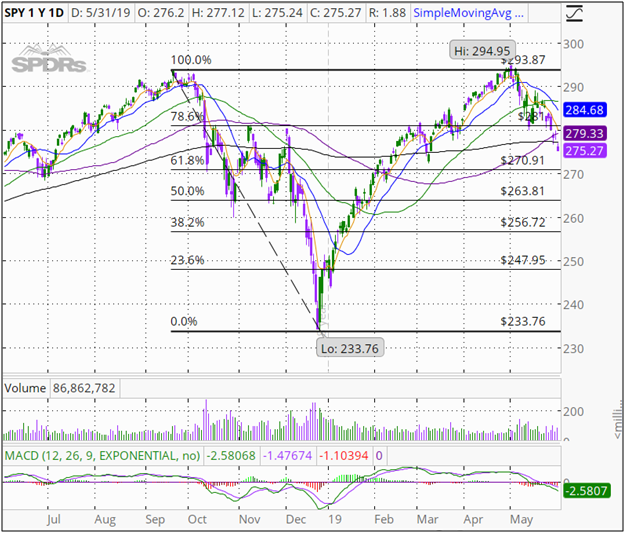
), to represent the overall price pattern and trend of the markets. At the end of April, the SPY fully retraced the 20% 3-month bear market selloff that occurred in fall of 2018. But in May the SPY gave back two and a half months of those gains. A daily chart of the SPY is presented below for this past year, including a Fibonacci retracement sequence for the bear market rebound. The chart shows that in May the SPY moved lower on higher volume, and closed below the 20, 50, 100, and 200 day major moving averages. Importantly, the SPY closed the month well below the .786 retrace level that provided resistance during both the bear market and the 2019 rebound.
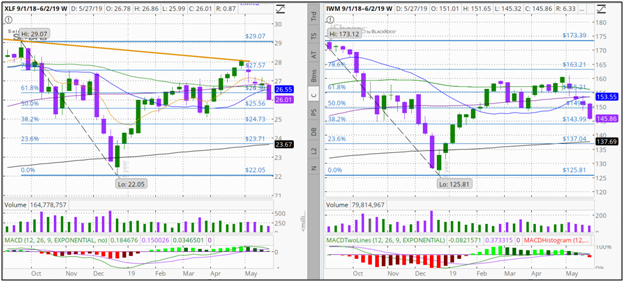
As I noted last month, the Nasdaq indexes fully retraced the 2018 bear market. However, financials, as represented by the
Financial Select Sector SPDR Fund
(
XLF
), left below, and "small caps", as represented by the
iShares Russell 2000 ETF
(
IWM
), right below, have still not fully retraced the bear market. As these weekly charts since September show, the XLF is now roughly midway between the .50 and .618 retrace levels, and the IWM is now only just above the .382 level. These are important because, as I have been taught, bull markets do not progress without the participation of these components. That said, the only favorable characteristic of this weakness is that volumes have generally declined each week as these indexes have fallen.
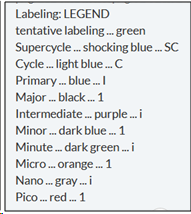
Elliott Wave Pattern
Since last year I have referred to the quantitative Elliott Wave pattern for the SPX by Tony Caldaro (
). Since the passing of Caldaro in February, the "OEW Group" has resumed the work of providing analysis of the market pattern. The most recent update indicates that the 2018 bear market was a Major 2 wave (down) within a larger Primary III bull market and that the Major 3 wave (up) is underway. So far, Minor wave 1 has completed. A zig-zag (down-up-down) of Minute level waves is unfolding, and it appears that Minor 2 is near completion. The OEW Group daily chart for the SPX is presented below.
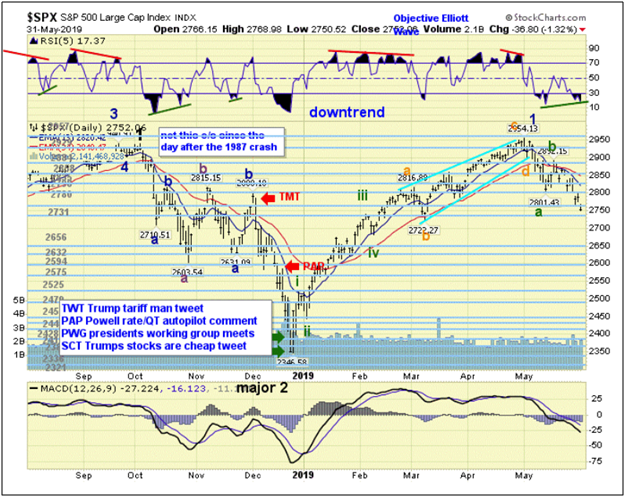
The OEW Group presents this commentary about the smaller waves within this pullback and the SPX support and resistance levels:
In all the years that I have followed the Caldaro site, I am constantly reminded that these patterns can take longer to play out than I would think. I entered some leveraged inverse trades in early 2019 for what I expected was a more imminent Minor 2 decline, but my timing was off some. Once the Minor 3 wave up is clearly underway, I expect my open long swing trades to start moving again.
With the pullback in May deepening for much of the month, I looked for opportunities to take some of the swing trade profits from previous months to add to income positions as well as enter new swings. While many REITs continued to hold up well, some higher-yielding closed-end funds began to trade at a widening discount to their Net Asset Value.
Portfolio Allocation
By the close of April, my overall portfolio was reduced to 37 holdings, but it rose to 42 by the end of May. The pie chart below shows the
percentage of the portfolio investment allocated to these assets
at the close of May. The holdings are listed by these categories in Section 8 below.
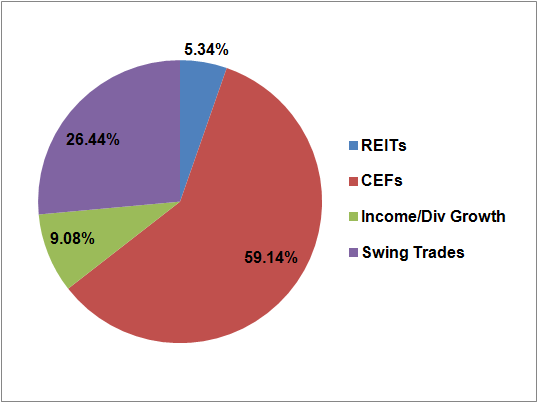
In April I moved out of 3 of my smaller and weaker Closed-End Funds and added to 4 better-performing CEFs. I continued to make adjustments in May as prices dropped lower with the market pullback, closing out of 1 CEF, adding to 6 existing CEFs, and starting positions in 3 CEFs.
I made these three fund purchases to further diversify my high yield income portfolio. CSQ is a $3.6 Billion fund that holds >600 stocks including leading large caps such as Apple (NASDAQ:
AAPL
), Microsoft (NASDAQ:
MSFT
), Amazon (NASDAQ:
AMZN
), JPMorgan (NYSE:
JPM
), Morgan Stanley (NYSE:
MS
), Johnson & Johnson (NYSE:
JNJ
), Google (NASDAQ:
GOOGL
), Chevron (NYSE:
CVX
), Pfizer (NYSE:
PFE
), and Bank of America (NYSE:
BAC
). ETG is smaller ($2.1 Billion fund of 200 stocks) with a smaller US concentration. And unlike my traditional acquisition of income-only, monthly distribution funds, RVT is a quarterly, managed distribution fund of mostly mid caps.
In May, I collected $760 in dividends, none of which was from swing trades closed in May. My 7-month average for this second year is $710. Dividends in May comprised 50.7% of total income compared to the 7-month average of 41.1%, because I closed fewer swing trades compared especially to the past 4 months.
Dividends from CEFs were $634 and comprised 83.4% of dividends this month. The 7-month average for CEF income is $597, and CEFs comprise an average 84% of non-swing trade income. I've tended to hold CEFs more than REITs because the CEFs generally pay monthly and have higher yields.
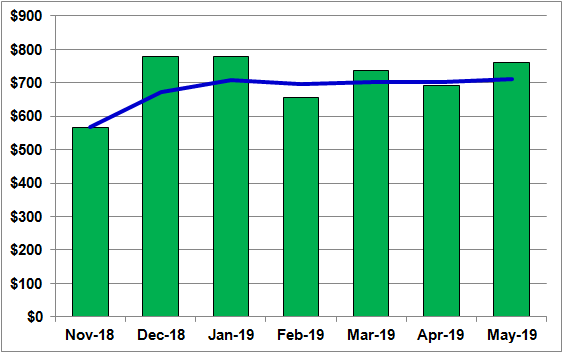
Total monthly income from dividends
excluding dividends from swing trades for this second year is presented in the chart below. The blue line on the chart is the average monthly dividend income. Total dividend income so far this year is $4,970 and is $5,188 when including dividends on closed swing trades.
For those new to my monthly updates, I provide some detailed information, charts, and my trade logs for swing trades in my weekly blogs for followers. I also have been posting what are, in effect, trade alerts as "updates" for readers of my weekly blogs. I post to the most current weekly blog any trades shortly after I place them. Readers are reminded to do their own due diligence when placing any trades.
Closed Swing Trades
In May, I closed 4 swing trades for a total profit of $740. I also closed out of 2 leveraged index ETFs for a total loss of -$497, the first losses in this second year of the portfolio. These losses are an opportunity cost as the funds are no longer available for other trades or income. The average investment for the 4 profitable trades was $2,368, and the average net gain was +$185. The total return on the swings averaged +7.81% for an average of 27 days in the trade.
The table below presents the dates, symbols, names, number of shares, sell prices, percentage gains, and number of days in the trade for the 6 trades closed in May.
I provide details for most of my swing trades in my weekly blogs. Given that these are mostly intended as shorter-term trades, I typically use technical chart levels such as gap fills or potential resistance at moving averages as the basis for my decision to sell any particular stock. Many of the stocks that I sell continue to advance in time, but my objective is to realize frequent, consistent profits, which I deploy to new trades.
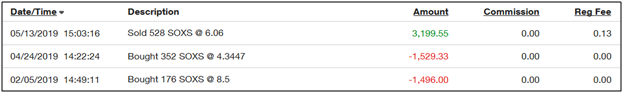
Below is my trade log for the SOXS trade, which was not included in my weekly blogs.
New Swing Trades
In May I opened 9 new swing trades and added to 1 existing position (NYSE:
WLK
), for a total investment of $20,918. Some details about these trades were provided in my weekly blogs, and I present a summary table below showing the date, ticker symbol, name, quantity, and share price for each of these 10 trades.
For readers who know my trading style, most of these stocks were generally very over-sold when purchased. I am looking for bounces in the 5-10% range, typically within about 30 or so trading days. However, I am content to wait longer if needed, and I can collect dividends on many of these stocks.
Non-Option Swing Trades
I use swing trading to add profits and grow my portfolio balance more quickly than through collecting dividends alone.
For the 7 months of my second year, I have been fortunate to close 54 profitable non-option swing trades out of a total of 56 trades, for a net gain of $7,210 including $218 in dividends on those trades. This represents an average weighted gain of +7.56% for an average of 33 trading days (+57.5% annualized). The chart below shows the
percentage gains for these non-option swing trades
for the second year of my portfolio. Trades closed in May are in blue.
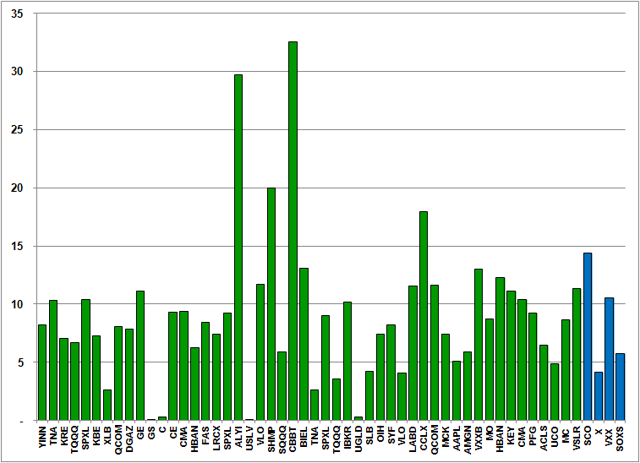
As I stated previously, a goal for this second year of my portfolio is to increase the investment cost of my swing trades. The average investment cost was $1,765 for all 54 profitable closed trades compared to $2,368 for the 4 trades closed in May, and the average net gain for those 54 trades was $134 compared to $185 for those closed in May.
Option Premium Swing Trades
I did not close any option premium swing trades in May, and my activity for option trades remains slow so far this year. I find that I have to spend more time watching the option trades and I recently do not have the time to do that.
My Green Dot portfolio generates cash income each month through dividends and profits from swing trades. These are realized gains or cash that is available for additional investment. In October, I raised my portfolio goal for this second year to a 10%+ annualized gain (average of 0.83%/month).
Total cash return for the past 19 months is now +21.48% with a monthly average of +1.13%. The monthly average cash earned for my first year was $1,063 and for this second year is $1,784. Total cash returns for May were +0.53%, which was lower than the past 4 months due to fewer closed swing trades.
The total gain for this past 7 months is now +8.72%, and the monthly average is +1.25%. So, for now, I am comfortably ahead of my target for my new 10% goal. This provides a buffer as I do not expect to increase my returns every month, especially from swing trades.
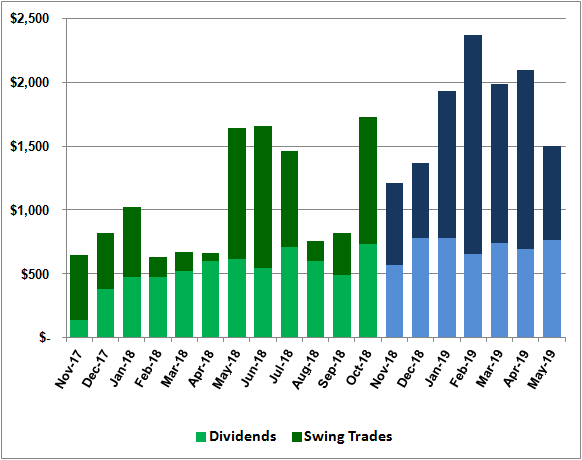
Looking over the progress of my portfolio since inception, two trends are clear. One is that I am growing the monthly cash balance and the other is that the growth is due primarily to increased swing trading. The chart below depicts the
monthly cash income and the proportion from dividends and from swing trades
. The first year results are shown in green and the second year results are shown in blue. Detailed data for the first year are provided in my October monthly update
article
.
I also am now making a concerted effort to increase the fixed income stream for my portfolio. Although I sold my position in RA in May, I bought 1,800 shares in 9 other CEFs at a total cost of $24,820.
Unrealized Gains/Losses
The total current value of all the positions in my portfolio at the end of May was -9.6%, about a percent lower than that for March and April. Given the market pullback in May, I am not concerned. I still have some longer-standing losing positions such as General Electric (
GE
), Kraft Heinz (
KHC
), Macquarie Infrastructure (
MIC
), and Colony Capital (
CLNY
) that I will continue to hold for now. While I wait, I'm receiving decent dividends from most of the portfolio, at an average of 8.3% for my 15 CEFs. These CEFs account for 63% of portfolio investment.
At the close of May, my portfolio consisted of 42 holdings, including 2 option premium swing trades and 2 penny stocks. The table below lists these holdings, including the current number of shares, average unit cost, dividend/distribution yield, and the percentage that they comprise of the overall portfolio investment.
While my gain this month was lower than for the past 4 months, I am still well on the way to meeting my annual goal of at least 10% cash income.
Over these past 19 months, I have presented my approach to managing a high-yield income portfolio with a swing trade boost. I think that I have demonstrated that many types of equities can be traded successfully, using primarily technical analysis of price patterns. At this point I don't think that I have any more tactics to share.
Over the past months, my readership has declined, with the April monthly update especially low, at almost half of the page views of previous months. I have gained fewer and fewer new followers each month it seems, and I receive very few comments and "likes" except from a few "regulars" (which I greatly appreciate!). Seeking Alpha has been testing a new "Reader Score" and my articles are apparently not judged to offer as much of value for readers as is expected. Compared to the base score of 1.0, I am getting scores averaging about 0.80. I thought that, by disclosing my swing trades as close to real time as possible, this might make a difference in readership, but it seems to have had limited impact.
Preparing updates takes more time than I comfortably have (setting up the charts, etc), especially during months when outdoor work is a priority. As well, I do other things with my time and I want to reduce my overall time for trading. I therefore need to limit my effort here if I am to continue at all. I should put the time into management of my portfolios, especially as I am scheduling additional transfers into my accounts.
I haven't made any final decisions. Perhaps I will write bi-monthly, or quarterly. I'd like to continue to post to the blog if that is of interest. I greatly appreciate the reader comments and will try to make time for that regardless. I honestly would probably have discontinued this earlier if it hadn't been for the interest from readers.
I wish readers well with their own endeavors!
Best to your investing/trading!
I am/we are long ABBV, ACLS, AMGN, AOD, AWF, BGX, BIT, CI, CLNY, CMA, CSQ, CVS, D, DSL, EMD, ERBB, ETG, FAX, FDX, FRME, FUTL, GE, HYT, INTC, JPS, KHC, KIO, LDP, MC, MIC, MMM, MSFT, NHTC, NIO, OSTK, RNP, RVT, SKT, SNV, WLK, X, XRX.
I wrote this article myself, and it expresses my own opinions. I am not receiving compensation for it (other than from Seeking Alpha). I have no business relationship with any company whose stock is mentioned in this article.
推荐文章
提价83%需求却暴增400%!智谱、MiniMax锁定大模型定价权,AI Agent元年即将开启?

港股见底了吗?北水大举加仓逾600亿港元!大行看好4月做多窗口来临,十大金股一图睇全
华盛早报 | 伊朗与阿曼拟共管霍尔木兹!美股V型反转;伊朗袭击甲骨文、亚马逊数据中心;港美股今日因假期休市一天
诺和诺德称:口服版Wegovy减肥效果优于礼来GLP‑1口服药
美股机会日报 | 特朗普粉碎停战幻想!恐慌指数飙升12%,纳指期货跌约2%;美油期货暴涨超9%!油气股飙升,美国原油基金ETF涨超9%
清明休市提醒 | 港股本周五休市,下周三恢复交易;美股周五休市一天
油价上涨 此前特朗普表示伊朗冲突可能在未来几周升级
野村:特朗普讲话未能发出局势降温的明确信号
