热门资讯> 正文
GDX: Gold Miners YTD Performance And Valuation Scorecard
2019-05-31 17:35
Gold miners remain weak with GDX down 3% YTD while individual holdings are in an effective \'bear market\' down on average 20% from their 52-week highs.
Combination of record gold production, overall soft demand, and a strong U.S. Dollar have been among the key drivers holding down gold prices in recent years.
A break higher above $1,350 for gold prices would likely bring in renewed bullish sentiment to the gold miners.
VanEck Vectors Gold Miners ETF
(NYSE:
GDX
) is the largest and most liquid exchange traded fund tracking the performance of equities in the gold mining industry. It's been a difficult couple of years amid a decade-to-forget for gold miners and precious metals in general. Looking back at the global commodity bust from 2011, the spot price of gold reached $1,895 that year and is down 32% to a current $1,280. Losses in GDX have been larger, falling over 60% over the period. The industry has evolved with a greater focus on efficiency and less leverage but there's still little to cheer about. GDX is down 3% in 2019 and 8.5% over the past year, significantly underperforming broad market indexes. This article highlights the recent performance and valuation metrics of the GDX holdings along with commentary on industry developments.
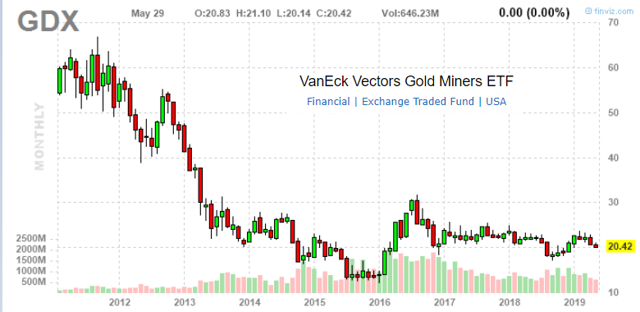
VanEck Gold Miners ETF price chart. Source: Finviz.com
The story for gold prices in recent years has been a combination of
record production
, overall soft demand, and a strong U.S. Dollar. Inflation globally particularly among developed markets has been lower than expected in recent years while overall steady growth absent of a cyclical slowdown in major markets has resulted in weaker sentiment for Gold as a safe haven asset. The current environment of renewed U.S.-China trade dispute tensions has not been enough for bullish momentum in the industry suggesting supply and demand forces have had a higher importance.
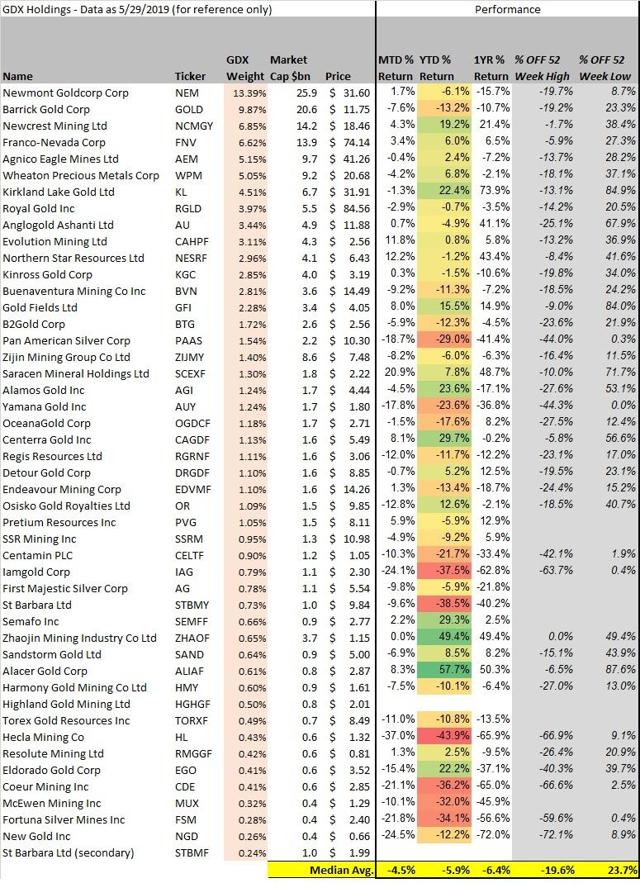
GDX underlying holdings performance source: Data YCharts/table by author
Newmont Goldcorp Corp.
(NYSE:
NEM
) is the largest of the miners with a market cap of $26 billion. The company completed its merger with the former Goldcorp this year to surpass the market cap of
Barrick Gold Corp.
(NYSE:
GOLD
) to become the largest gold producer in the world. This was one of the largest mergers in industry history and highlights other opportunities for targeted joint ventures or acquisitions especially including junior miners in the space. A greater trend of consolidation could be a direction gold miners are headed if prices remain stagnant. NEM is down about 6% YTD 2019.
Small-cap
Alacer Gold Corp.
(
OTCPK:ALIAF
) with a market cap of about $800 million is the best performer of the year in GDX with its stock price up 58% YTD. The company produced over 89,000 ounces of gold in the first quarter generating about $35 million in free cash flow which it used to reduce net debt by about $22 million to $215 million. The company is forecasting strong increasing production in 2019. Gold miners able to ramp up production with sustainable free cash flow have been rewarded by the market on a relative basis in recent year.
Among large cap miners,
Australia's Newcrest Mining Ltd.
(
OTCPK:NCMGY
) is up 19.2% YTD and Canada's
Kirkland Lake Gold
(
KL
) up 22.4% YTD have been strong performers. Newcrest is also a major copper producer reporting 33% increase in copper production year over year while gold output is up a smaller 7%.
At the other end,
Hecla Mining Co.
(
HL
) is the worst performer in 2019 down 43.9% and 66% over the past year. The U.S. company with operations in the state of Nevada has reported weak production and balance sheet leverage is becoming a concern. The company acquired Klondex Mines (
KLDX
) last year for $460 million last year in an ambitious deal but has faced setback with operating difficulties at some of its largest facilities.
Overall it continues to be a tough environment for the miners. The median average stock in GDX is down about 20% from their respective 52-week highs even as most recovered off deeper lows in 2018. The industry is volatile and there lacks a clear catalyst for a sustained move higher.
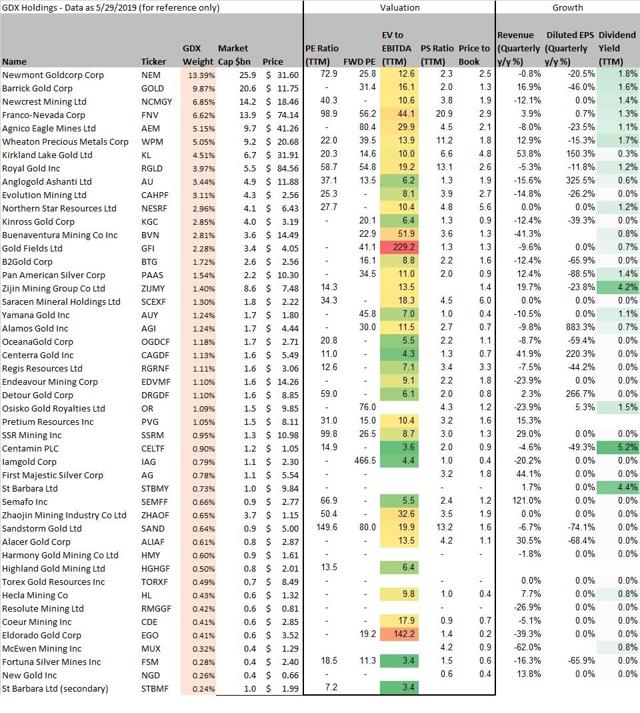
GDX underlying holdings performance source: Data YCharts/table by author
Valuation ratios across GDX holdings are difficult to compare given the number of OTC issuers with lack of published earnings estimates. Based on my data 23 of the 47 companies did not produce positive earnings over the past year leading to a wide range of PE multiples. The fund manager discloses that the average PE ratio for the last 12 months is 33.83x, which I was able to approximate at 32x by taking the weighted average including only the companies that were profitable. On a price to sales basis, the median average of 1.5x matches the fundamentals data at the ETF level. The average dividend yield among the stocks that pay a dividend is 1.6%, although the stated yield for the ETF on a weighted average basis is 0.5%
A couple of outliers in the group like
Gold Fields Ltd.
(
GFI
) at 229x and
Eldorado Gold Corp.
(
EGO
) 142x somewhat skew the data for the standard EV/EBITDA, given some restructuring charges over the past year.
Among large caps,
Kirkland Lake Gold
(
KL
) screens wells with a set of valuation ratios that at face value imply something of a value in the group. A forward price to earnings ratio at 14.6x and EV/EBITDA at 10x deserves a closer look.
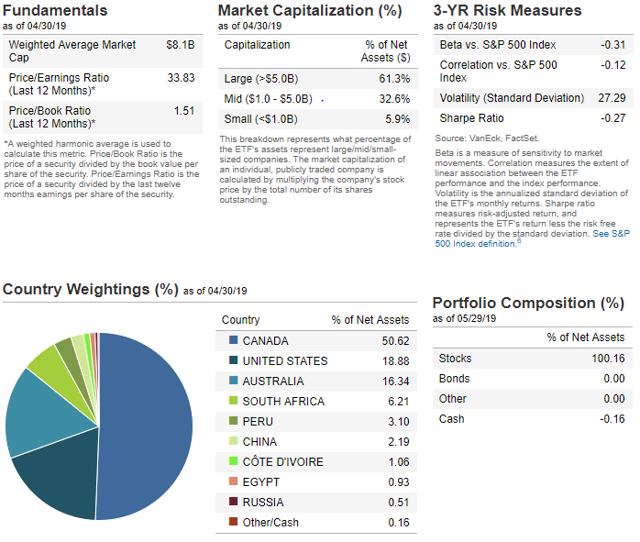
GDX fund analytics. Source:
VanEck
I think GDX is a great option to gain exposure to trends in the gold industry through a diversified portfolio. The expense ratio is 0.52% which is in line with similar industry-specific ETFs. Investors should know that the ETF is typically more volatile than the Gold commodity price given the sometimes high leverage of the underlying companies. This means that it's expected that GDX will outperform spot gold to the upside and under-perform to the downside all else equal.
In the near term, GDX appears stuck in a relatively tight trading range since about 2017 between $20 and $25, a clear break to the upside above $23, likely corresponding to spot gold prices above $1,350, should signal a more bullish momentum. A move below the 2018 low around $18 would signal a deeper deteriorating of the outlook. The higher trend in the U.S. Dollar remains among the main bearish factors against higher gold prices in the near term. I'm generally bullish on gold prices and gold miners at the current level but given the lack of clear catalyst I remain on the sidelines awaiting a confirmation of a sustainable trend higher.
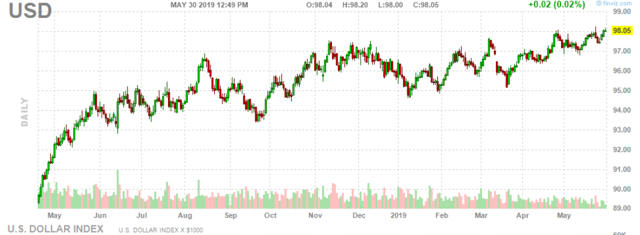
US Dollar Index daily price chart. Source: Finviz.com
I/we have no positions in any stocks mentioned, and no plans to initiate any positions within the next 72 hours.
I wrote this article myself, and it expresses my own opinions. I am not receiving compensation for it (other than from Seeking Alpha). I have no business relationship with any company whose stock is mentioned in this article.
推荐文章
美股机会日报 | 止跌企稳!纳指期货盘前涨约0.5%,有分析称美股连遭重挫后或回升;亚马逊盘前大跌超8%

一周财经日历 | 事关降息!美国1月非农、CPI数据下周公布;恒指季检结果下周五揭晓
华尔街大多头漫谈黄金“黑天鹅”风险:马斯克实现太空采金,化身全球央行行长
避险情绪席卷市场 华尔街青睐的热门交易纷纷崩跌
华盛早报 | 无一幸免!美股、金银、加密货币与原油集体崩盘;南向资金爆买250亿港元!创约半年来新高;千问APP今日启动30亿免单
亚马逊股价盘后大跌近10%,巨额资本支出引发担忧
比特币暴跌带来124亿美元巨亏 Saylor的金融实验岌岌可危
2月6日外盘头条:比特币暴跌 亚马逊预计今年资本支出将达2000亿美元 交易员料美联储将比预期更早降息
