热门资讯> 正文
我的10%收入投资组合-动量数据
2019-05-22 23:00
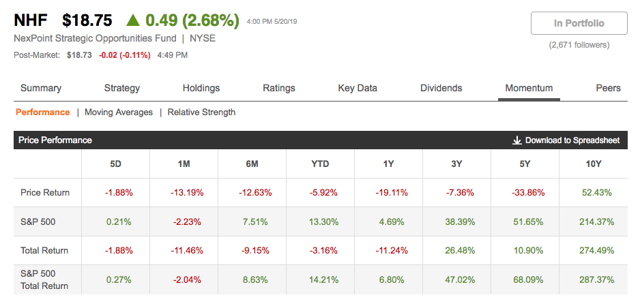
- NexPoint Credit Strategies Fund(NHF) 0
- DoubleLine收益解决方案基金(DSL) 0
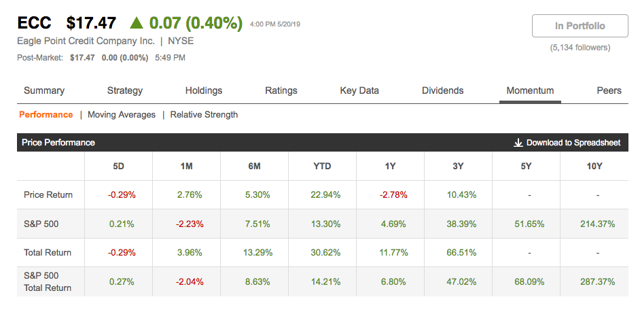
- Eagle Point Credit Co., Inc.(ECC) 0
As with mutual and exchange-traded funds, closed-end funds have associated fees and expenses. Dividing a fund’s operating expenses by its total assets makes up the expense ratio for the fund.
The return performance of a fund, minus fees and expenses, determines the net distribution rate for the funds in my portfolio as illustrated in this article.
Momentum data makes it possible for investors to compare the Total Return for each closed-end fund versus the S&P 500 Index over three, five, and ten years.
Keep in mind that when looking at CEFs, you should consider more than just price return because of large distributions paid out by most of them.
As Benjamin Graham points out in his book,
, 2003 Revised Edition, “Suppose, as a practical test, we had asked a hundred security analysts to choose the ‘best’ five stocks in the Dow Jones Average, to be bought at the end of 1970. Few would have come up with identical choices and many of the lists would have differed completely from each other. This is not so surprising as it may at first appear.”
In fact, as Graham says further on, “…the view of any analyst that one stock is a better buy than the rest must arise to a great extent from his personal partialities and expectations, or from the placing of his emphasis on one set of factors rather than on another in his work of evaluation.”
Can the same be said about funds, and in particular about closed-end funds (
CEFS
)? I believe so. If you ask a group of analysts to choose the best ten CEFs, their lists would surely be different from each other. We can see this from the comments on the investment websites, including Seeking Alpha. Each investor has a preferred list of CEFs and those of us on Seeking Alpha use this platform for bouncing investment ideas off one another.
Some years ago I selected the following CEFs for my portfolio. As I stated in my first article, “
Building A 10% Income Portfolio
,” I believe that it is best to own quality funds, run by some of the best managers in the CEF segment. However, good management tends to be expensive. Let’s see how these funds behave from a momentum perspective.
As with open-end and exchange-traded funds, closed-end funds charge management fees and incure expenses, primarily in the form of interest charges in the case of debt-leveraged CEFs. Interest charges are true expenses, but provided the cost of borrowing is lower than the extra gain achieved, debt-leveraged CEFs bring you the benefit of the increased returns connected with leverage.
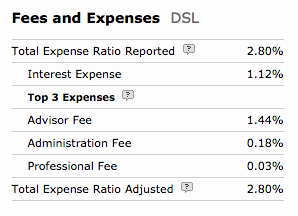
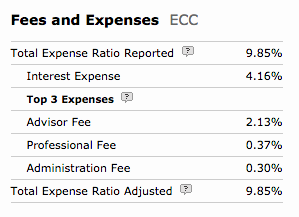
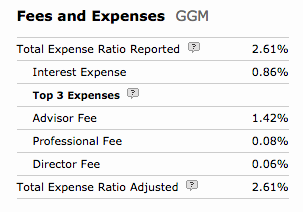
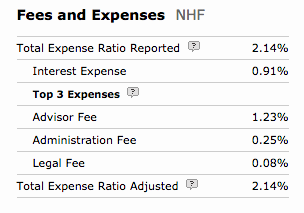
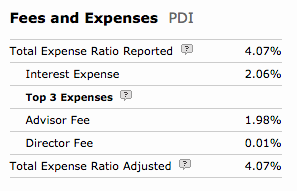
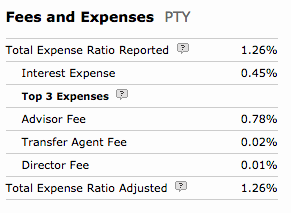
The following tables show fees and expenses for the funds in my portfolio, as reported for most recent fiscal year.
(Source: Morningstar)
(Source: Morningstar)
(Source: Morningstar)

(Source: Morningstar)
(Source: Morningstar)
(Source: Morningstar)
(Source: Morningstar)
As you can see, the fees and expenses for the CEFs in my portfolio range from a low of 1.26% for PTY through the midpoint of 4.07% for PDI, up to the impressive high of 9.85% for ECC (Morningstar Category: Bank Loan). The remaining four funds fall between the low and midpoint.
For many investors, both fees and expenses of CEFs are a concern, especially when compared to the low charges for mutual funds and ETFs. However, unlike many of the funds with low charges, CEFs tend to be actively managed.
The following quote from Forbes article "
8 Rules For 8% Income Investing In CEFs
" highlights the difference: “Most investors are conditioned by their experience with mutual funds and ETFs to search out the lowest fees, almost to a fault. This makes sense for investment vehicles that are roughly going to perform in-line with the broader market. Lowering your costs minimizes drag. Closed-ends are a different investment animal, though. On the whole, there are many more dogs than gems. It’s an absolute necessity to find a great manager with a solid track record. Great managers tend to be expensive, of course—but they’re well worth it.”
It’s up to you to decide if you want a dog or a gem.
These fees and expenses, when divided by the fund’s total assets, represent the expense ratio for each fund, that is the actual cost to an investor for owning the shares in the fund.
Fees and expenses are costs paid by the fund itself from its net asset value (
NAV
). The distributions you receive are, in fact, always net; you don’t see the fees and expenses because your personal account is never directly charged for them. Because costs are paid from the fund’s NAV, the NAV often appears stagnant even though shareholders receive notable returns.
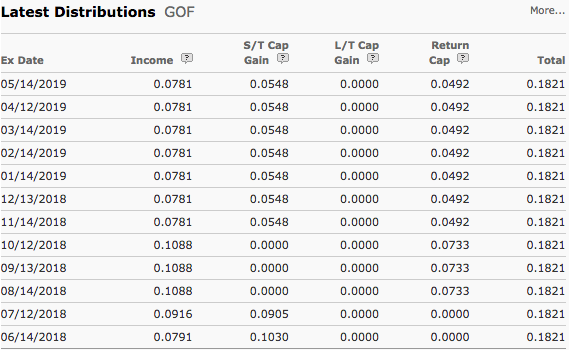
The following table shows the current distribution rates for the seven closed-end funds in my portfolio. The average distribution rate for these seven funds is more than 10.50%.
* On April 20, NHF announced rights offering expiring on May 22. The closing price on April 20, 2019 was $23.17.(Source: Morningstar)
Note that last months’ consistent return of capital for GOF raises some concerns about the sustainability of its current distribution rate, even if the enduring 10%+ premium seems to demonstrate the market’s faith in its management.
(Source: Morningstar)
While looking at a fund’s expense ratio and distribution rate provides insight into its current performance, it is useful to compare how this performance varies over time.
Momentum is the tendency of assets to follow their current trend: those that have gone up in price tend to continue going up, while those that have gone down in price tend to continue going down.
In January, 2019, Seeking Alpha introduced the Momentum tab on its website. The information on the Momentum tab provides investors with price performance and total return information and comparison charts for a stock or fund, directly from the quote page.
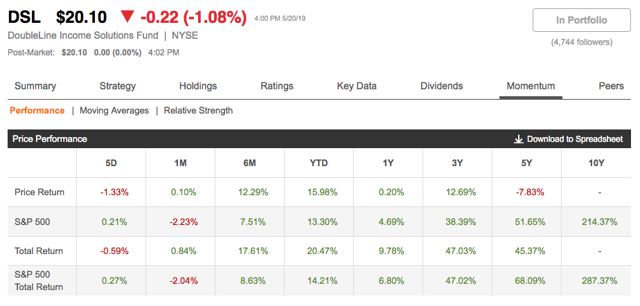
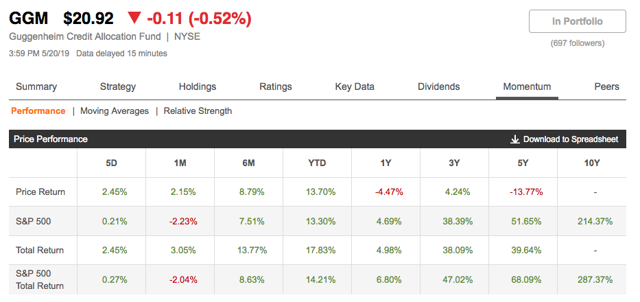
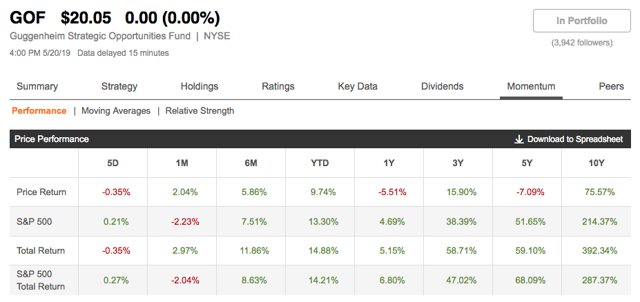
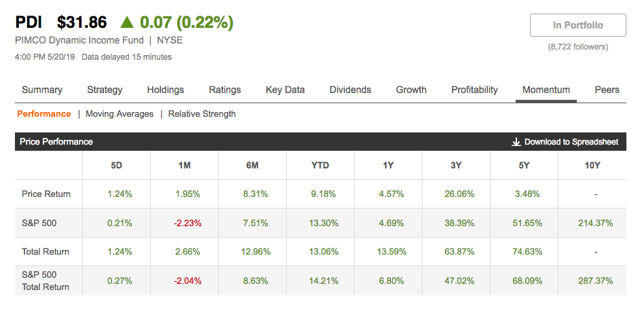
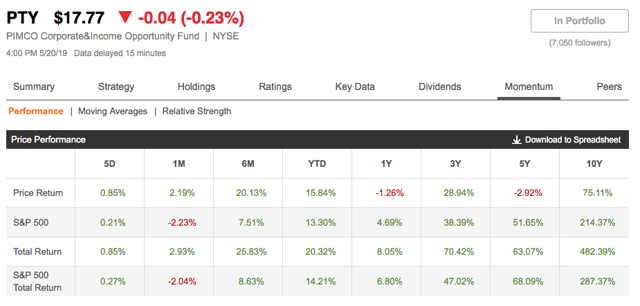
Using the information on the Momentum tab, let’s compare the Total Return data for the seven CEFs in my portfolio to that of the S&P 500 Index.
(Source: Seeking Alpha)
(Source: Seeking Alpha)
(Source: Seeking Alpha)
(Source: Seeking Alpha)
(Source: Seeking Alpha)
(Source: Seeking Alpha)
(Source: Seeking Alpha)
With the exception of PDI, none of the funds in my portfolio beat the S&P 500 Total Return over the last five years (ECC has been available for less than five years).
GOF did beat the S&P 500 Total Return over the last three years.
In addition, GOF and PTY beat the S&P 500 Total Return over the last ten years, while NHF is almost on par.
The remaining four funds are younger than ten years.
Based on the Total Return data, the only funds showing a superior long-term return are GOF, NHF and PTY. Based on its current upward momentum, PDI appears to be bound for glory too. Compared to those four funds, DSL, ECC and GGM do not show the same upward momentum. However, they always guarantee a steady income to shareholders, which is the primary purpose for investing in CEFs.
Each investor has his own beliefs, certainties and expectations about every CEF on the market, which makes the game of choosing CEFs challenging. For my part, I continue to stick with the seven funds I currently hold.
However, I am continuing to look for the right moment to expand my portfolio with new entries like Pimco Income Opportunity (
PKO
) (see my last article , “
My 10% Income Portfolio—Exploring New CEF Opportunities
”.)
I am aware of the fact that the managers for the CEFs in my portfolio might be considered as expensive, but with an overall distribution rate of more than 10%, I believe that it is money well spent.
In some cases the CEFs in my portfolio suffer in the comparison of their Total Return over the years with that of S&P 500, but in light of my goals, the overall performance so far is very satisfying.
I am/we are long DSL, ECC, GGM, GOF, NHF, PDI, PTY.
I wrote this article myself, and it expresses my own opinions. I am not receiving compensation for it (other than from Seeking Alpha). I have no business relationship with any company whose stock is mentioned in this article.
推荐文章
美股机会日报 | 就业数据转弱!美国至2月7日当周初请失业金人数超预期;存储概念股盘前齐升,闪迪大涨超7%

要点速递!《跑赢美股》春节特别直播核心观点总结
华盛早报 | 非农数据大超预期!首次降息或延至7月;AI恐慌交易蔓延至房地产服务板块, CBRE暴跌12%;智谱发布新模型
美股机会日报 | 经济数据强劲!美国1月非农就业大超预期,纳指期货涨至0.6%;AI应用股业绩超预期,Shopify涨超10%
资金复盘 | 北水净买入港股超48亿港元,逾7亿港元抢筹腾讯
华盛早报 | “AI威胁”波及华尔街!财富管理公司全线暴跌;豆包官宣“参战”!春节AI红包战愈演愈烈
美股机会日报 | 科技巨头迎利好?特朗普政府拟结构性豁免芯片关税;台积电1月销售额创历史新高,盘前股价涨近3%
一图看懂 | 净利大增60.7%!中芯国际Q4营收24.9亿美元,同比增长12.8%
