热门资讯> 正文
ETF第3个月:11%-收益QYLD,一种替代MQQX的ETF
2019-05-15 20:23
- Nuveen S&P 500 Dynamic Overwrite Fund of Benef Interest(SPXX) 0
- Nuveen NASDAQ 100 Dynamic Overwrite Fund(QQQX) 0
- Columbia Seligman Premium Technology Growth Func Inc(STK) 0
QYLD is a defensively-orientated option income fund tracking the Nasdaq.
QYLD has substantially underperformed the benchmark QQQ over the tech-led bull market, but it has actually done slightly better on a risk-adjusted basis.
However, QYLD may still be attractive for investors looking to monetize the capital potential of tech stocks, or as a rotation candidate for QQQX.
During "
ETF Month
,
" I will focus on profiling different exchange-traded funds. Some of these will be income focused, whereas others may not be. Additionally, I may profile some
higher risk
sector-specific or leveraged ETFs that I can find particularly interesting. Hence, none of the ETFs profiled this month should be automatically considered to be "buy" recommendations.
(Note: due to the delay to the start of the series, "ETF Month" will be designated as lasting throughout May)
I also will be taking ETF suggestions, so do let me know if you have any ETFs on your horizon.
What are the advantages and disadvantages of ETFs compared to CEFs?
There are exceptions to the above, of course. Some ETFs are actively managed and will have higher fees. Illiquid ETFs may trade at significant premiums or discounts to their NAV, which demands caution when buying or selling those funds. A few ETFs use a managed distribution policy, such as Global X SuperDividend ETF (
SDIV
), which is profiled in the first ETF Month feature.
Basic details of
Global X Nasdaq 100 Covered Call ETF
(
QYLD
) are shown in the table below. I also will be comparing QYLD with a much more popular CEF, the
Nuveen Nasdaq 100 Dynamic Overwrite Fund
(
QQQX
), and details for this ETF also are provided.
(Source: Morningstar)
Global X Nasdaq 100 Covered Call ETF
(
QYLD
) was previously known as the
, and then before that as the
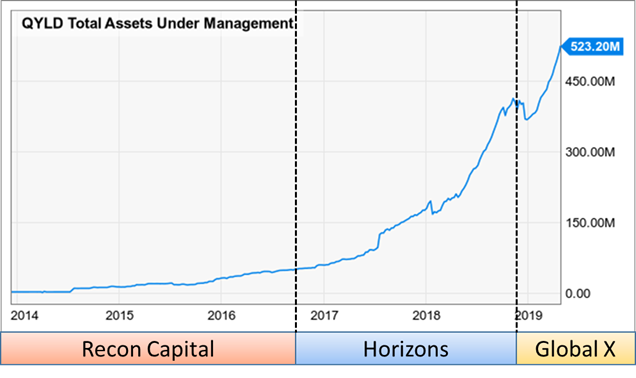
. The first name change was made when Mirae Asset Global Investments' subsidiary, Horizons ETF,
acquired
Recon Capital Advisors in November 2016. Subsequently, Mirae
acquired
Global X in July 2018, and decided (in December 2018) to rebrand all of its Horizon products under the better known "Global X" name.

What's in a name? For ETF branding, it turns the answer is quite a lot.
QYLD struggled through its first several years of existence under the little-known "Recon Capital" brand, amassing less than $100 million in AUM even after three years. However, after Mirae's "Horizons" ETF unit acquired QYLD, the AUM really started taking off. A further boost resulted from Mirae's acquisition of Global X in July 2018, and after the fund was rehoused (in December 2018) under the highly marketed Global X brand, the AUM has again reached new highs in 2019. A tangible bonus from the last merger/rebranding is that Global X ETFs trade commission free from several brokers including Charles Schwab, E*TRADE and Interactive Brokers.
QYLD is a
passive
ETF
that holds identical stocks to those in the Nasdaq 100 index (or the benchmark ETF, Invesco QQQ ETF (
QQQ
)). The top holdings of QYLD are shown in the table below.
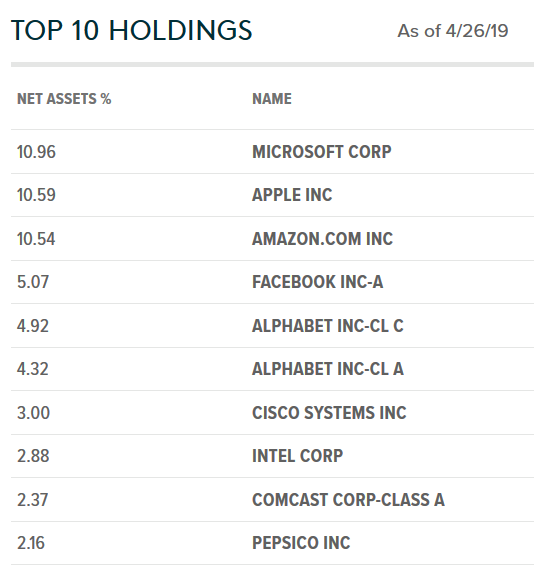
(Source: Global X)
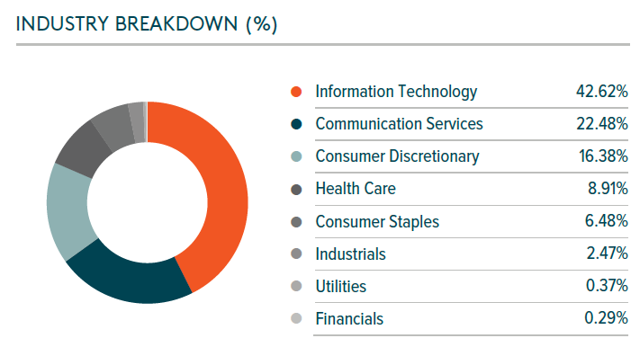
The industry breakdown, as expected, is heaviest in information technology (42.62%) and communication services (22.48%).
In terms of the buy-write strategy, QYLD tracks the
CBOE Nasdaq-100 BuyWrite V2 Index
.
The original "
Nasdaq
" ("BXN") holds the stocks in the
Nasdaq
100 and writes a succession of
one-month
,
at-the-money
,
Nasdaq-100
index covered call options
.
The newer
("BXNT") replicates the methodology for BXN, but with one exception: the index call options are
held until one day prior to the expiration date and are liquidated
at a volume-weighted average price determined at the close. Presumably, this change allows the fund to avoid having its options exercised and having to deal with the ramifications of this.
The call options for the BuyWrite indices cover
100%
of the value of the portfolio, making QYLD a relatively
defensively orientated
fund. In other words, QYLD is going to lag the
Nasdaq
100 in bull markets, but provide some downside protection in bear markets.
In contrast, Nuveen's CEF, QQQX, is actively managed. It "seeks to substantially replicate the price movements of the Nasdaq 100 Index" but is not required to hold
Nasdaq
100 stocks exactly at their index proportions (its 162 holdings is evidence of this!). Additionally, QQQX sells call options "on 35%-75% of the notional value of the Fund’s equity portfolio (with a 55% long-term target)," making the CEF less defensive than QYLD which has 100% coverage.
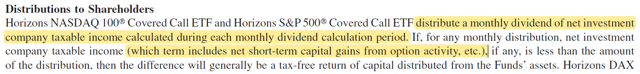
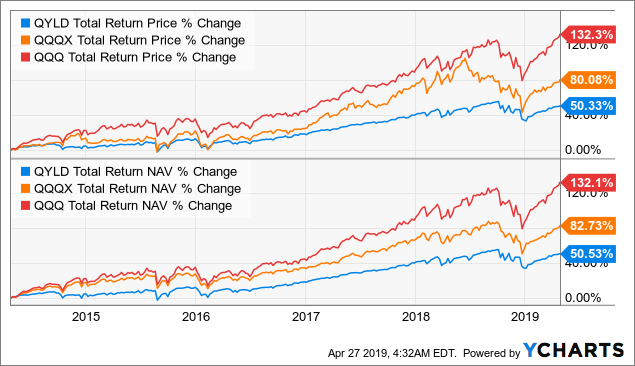
QYLD distributes monthly which may be attractive for income investors. However, QYLD
does not use a managed distribution schedule
, so the payout can fluctuate from month to month (ranging from 0.43% to 1.08% per month since inception). The ttm yield is a very attractive
10.70%
on a ttm basis.
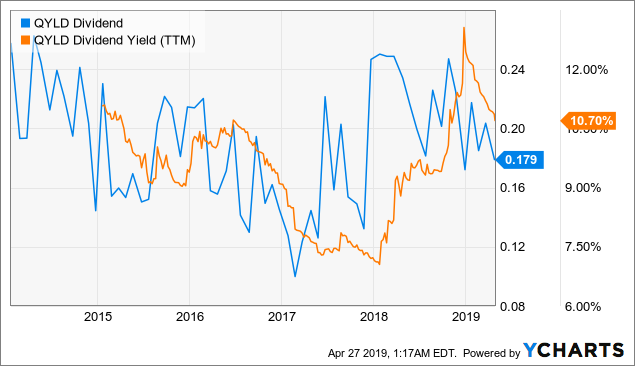
Data by YCharts
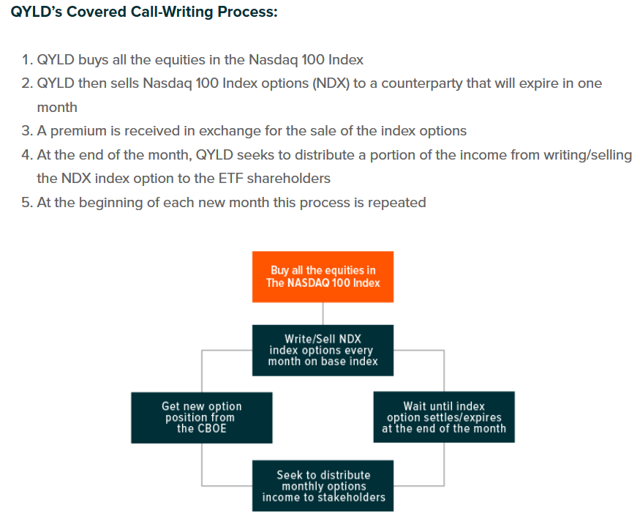
As the flowchart below shows, QYLD "seeks to distribute a portion of the income from writing/selling the NDX index option to ETF shareholders." Hence, the payout from QYLD will rise and fall depending on how much income is received from writing calls each month.
(Source: Global X)
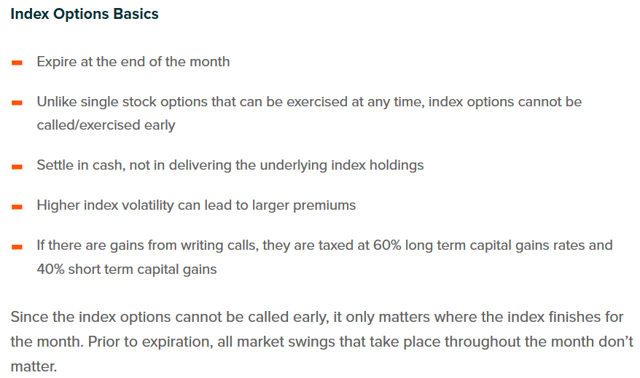
Global X also provides the additional following info on the index call options written by QYLD.
(Source: Global X)
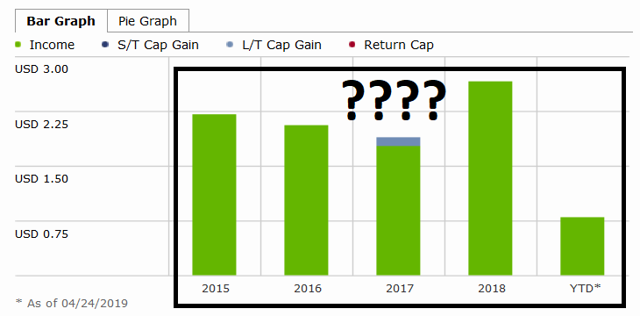
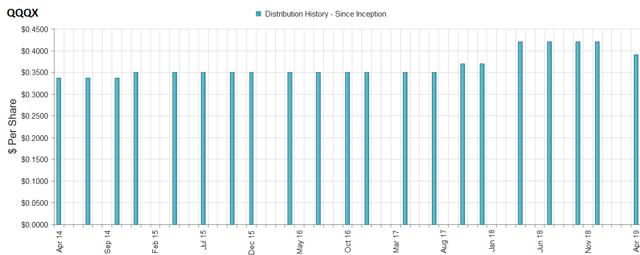
Note that Morningstar's chart on the sources of distribution for QYLD is wrong.
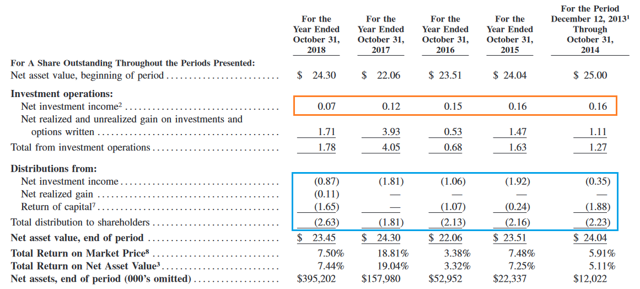
We can look into the fund's latest annual report to see what the sources of distributions they reported was. We can see from the table below that the actual net investment income received for the ETF is very low, as expected since the dividend yield of the underlying tech-heavy portfolio is not going to be high. Yet, the ETF has somehow managed to "recharacterize" a substantial proportion of distributions as coming from net investment income over the last five years. How is this possible?
(Source: Global X)
The answer is that when distributing the monthly dividend, net short-term capital gains from option activity are counted as part of the taxable income. See this from the fund's annual report below:
(Source: Global X)
This appears to be in slight contradiction to Global X's blurb above which states that gains from writing calls are "taxed at 60% long-term capital gains rates and 40% short term capital gains." If any tax experts would like to step in and offer an explanation of this, please feel free to do so!
Read
ers also are recommended to consult with their tax advisor before placing QYLD in their taxable.
Long story short, regardless of how various sources of distributions can be characterized and recharacterized, it should be obvious based on the fund's portfolio and strategy that most of the distributions from QYLD are going to come from capital appreciation and option income. Similar to equity CEFs, if the market crashes, we would absolutely expect future payments to be decreased.
In contrast to QYLD's irregular payout schedule, QQQX uses a managed distribution policy which tries to keep the quarterly payments relatively steady.
(Source: CEFConnect)
QQQX's sources of distribution look accurately reported by Morningstar, consisting primarily of long-term capital gains and return of capital. The tax-friendly nature of QQQX's distributions could make this fund more appealing in a taxable account.
(Source: Morningstar)
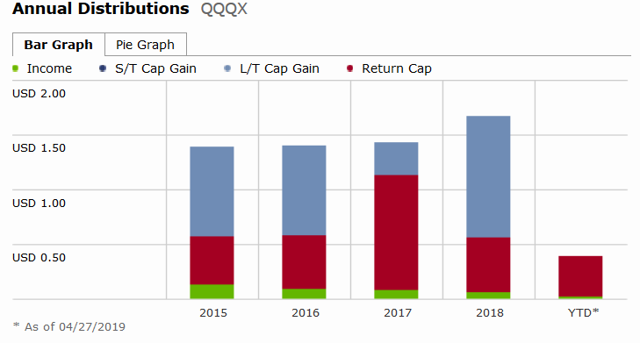
Since QYLD is a relatively defensive option income fund (100% option coverage), it would be expected to substantially lag the underlying portfolio during bull markets. Over the last five years, QYLD has returned +50.33% on a total return basis, far below QQQ's +132.3% return. QQQX, which is moderately defensive due to its ~55% option coverage, sits in between with a +80.08% return on price and +82.73% return on NAV.
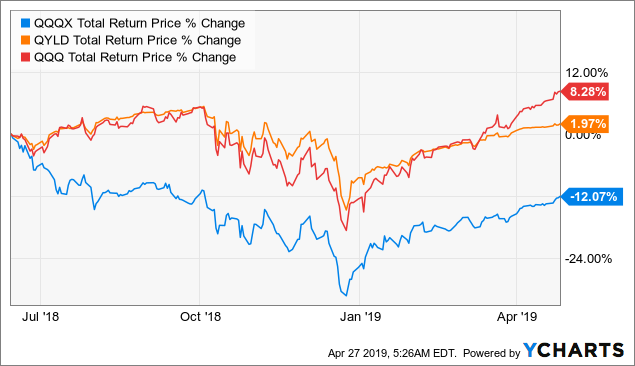
In contrast, during flat or falling markets, QYLD is expected to outperform. This was in display during last year's correction, where QYLD fell by -13.00% over a six-month period compared to -16.90% for QQQ, and -16.15% or -15.84% for QQQX on a price or NAV basis.
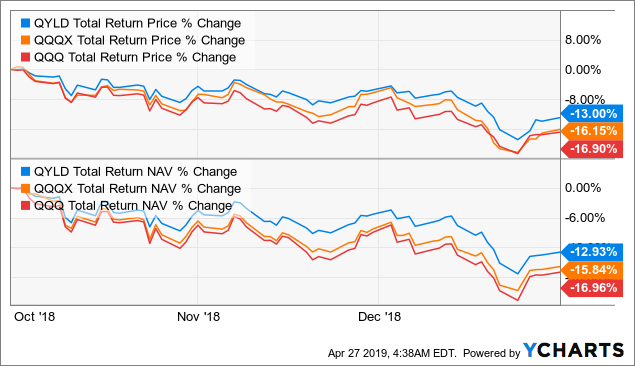
Data by
YCharts
Obviously, QYLD is a poor investment for those investors looking to achieve capital appreciation from tech stocks. And it might seem a little ridiculous to boast about having downside protection of merely ~3-4% in last year's correction when the fund has been massively trailing QQQ over the lat five years. However, two things should be borne in mind. First, it has been shown for the S&P 500 that call-writing strategies outperform long-only strategies over the
full-market cycle
. Hence, the past five years of bull market (despite two moderate corrections) has not given QYLD much of a chance to display its defensive nature. One caveat to this is that the historical studies were performed for the S&P 500 and not the
Nasdaq
. It's debatable whether the higher volatility of
Nasdaq
stocks benefits or impairs a covered call strategy. On one hand, premiums are likely to be richer because of the higher volatility of the underlying stocks. On the other hand, the strategy will show serious underperformance when the underlying index rallies strongly.
The second thing to bear in mind is that the last several years, aside from the tech bubble, have been some of the best in history for tech stocks, thus magnifying the underperformance of call writing strategies vs. a long-only portfolio. For example, Horizons' other covered call ETF tracking the S&P 500, the
Horizons S&P 500 Covered Call ETF
(
HSPX
) has lagged SPY by "only" ~35% over the last five years, a far cry from the ~80% differential between QYLD and QQQ. Moreover, HSPX has even kept pace on a NAV basis compared to the moderately defensive Nuveen S&P 500 Dynamic Overwrite Fund (
SPXX
), Nuveen's S&P 500 equivalent of QQQX.
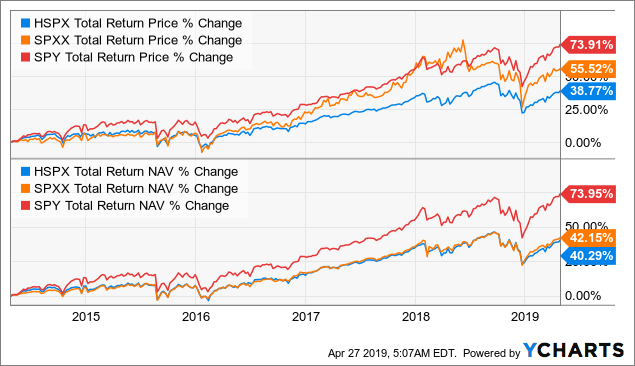
Data by YCharts
Yet, notwithstanding all of the above, QYLD, or rather, the underlying index, has still shown favorable
risk-adjusted
metrics compared to the
Nasdaq
100 index since inception of the ETF. While it has shown significantly lower return, it also achieved about 30% lower annualized volatility and 35% lower beta compared to the long-only index, giving it a higher Sharpe Ratio (a measure of risk-adjusted return) of 0.59 than Nasdaq's 0.42. In other words, the covered call strategy used by QYLD has achieved a higher return per increment of risk taken, versus a buy-and-hold strategy on the same portfolio (the
Nasdaq
100).
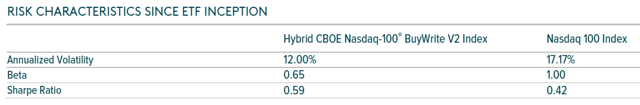
(Source: Global X)
Note that I've shown both the total return price and total return NAV profiles in the charts above because QQQX and SPXX are CEFs, so their total price returns may deviate from their NAV returns due to changes in premium/discount valuation. On the other hand, ETFs such as QYLD and HSPX nearly always trade close to their NAV.
This does open up the possibility of using QYLD as a rotation candidate for QQQX when the latter becomes overvalued on a premium/discount basis. For example, last June we recommended swapping from QQQX to
Columbia Seligman Premium Technology Growth Fund
(
STK
) on the basis of the former's overvaluation (see
A Tech Option Income CEF Puzzler
) (
public link
). In only around 10 months, STK has outperformed QQQX by a massive 16%, equivalent to about
two years' worth of distributions from QQQX
.
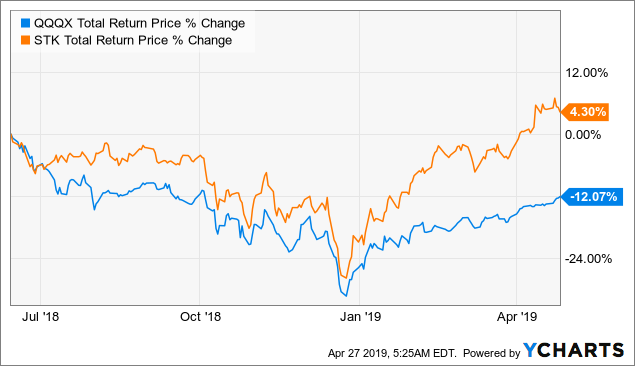
One other rotation candidate besides STK that I've suggested before (though not in the above linked article) is a 50:50 mix of QYLD and QQQ. The idea is that combining QYLD with its 100% option coverage and QQQ with its 0% option coverage would generate a similar profile to the underlying NAV performance of QYLD, with its ~55% coverage target. Indeed, this mixture would also have massively outperformed QQQX over the same time frame.
Data by YCharts
Right now, QQQX with its +0.22% premium can be considered to be fairly valued. At this valuation, we have QQQX rated as a "hold" in our CEF Watchlist (buy under discount: -5%; sell above discount: +5%).
While QYLD has substantially underperformed the long-only QQQX over the past five years, it should also be remembered that (1) a defensive strategy will only demonstrate its advantages over a full market cycle, and (2) the last few years have been some of the best for tech stocks in history. Another point in favor of QYLD is that the covered-call strategy has actually provided a slightly higher risk-adjusted return since inception of the ETF compared to the long-only index.
QYLD may be attractive for investors looking to monetize the capital return potential of tech stocks on a monthly (though irregular) dividend basis. QYLD also can be a rotation candidate for the CEF, QQQX, when the latter becomes overvalued on a premium/discount basis. However, it may not be suitable for investors looking to capture the full extent of the capital appreciation of tech stocks.
I am/we are long THE PORTFOLIOS.
I wrote this article myself, and it expresses my own opinions. I am not receiving compensation for it (other than from Seeking Alpha). I have no business relationship with any company whose stock is mentioned in this article.
推荐文章
港股周报 | 中国大模型“春节档”打响!智谱周涨超138%;巨亏超230亿!美团周内重挫超10%

一周财经日历 | 港美股迎“春节+总统日”双假期!万亿零售巨头沃尔玛将发财报
一周IPO | 赚钱效应持续火热!年内24只上市新股“0”破发;“图模融合第一股”海致科技首日飙涨逾242%
从软件到房地产,美国多板块陷入AI恐慌抛售潮
Meta计划为智能眼镜添加人脸识别技术
危机四伏,市场却似乎毫不在意
美股机会日报 | 降息预期升温!美国1月CPI年率创去年5月来新低;净利、指引双超预期!应用材料盘前涨超10%
财报前瞻 | 英伟达Q4财报放榜在即!高盛、瑞银预计将大超预期,两大关键催化将带来意外惊喜?
