热门资讯> 正文
The Chemist的“高-高-低”封闭式基金报告:2019年3月
2019-04-25 21:00
Only funds with yield over 7.5%, coverage higher than 90%, and trading at a discount are considered!
Top lists of discount, z-score, yield, D x Y and D x Y x Z are given.
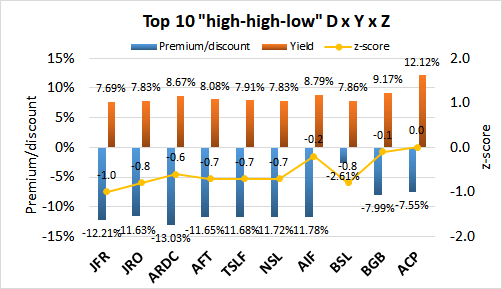
The top-ranked D x Y x Z funds are JFR, JRO, and ARDC.
Quantitative screens help to rapidly narrow down attractive candidates from the database of 500+ closed-end funds (CEFs) for further due diligence and investigation. The "High-High-Low" report was inspired by a member of
CEF/ETF Income Laboratory
, who wrote:
The "High-High-Low" report, therefore, screens for the following 3 attributes that we would like to screen for:
Note that the above thresholds are subject to change, based on the number of eligible CEFs there are that satisfy all three of the criteria. I try to aim for a minimum of at least 20 eligible funds so that the "top 10" list actually means something (top 50% of the screen).
As for the Quality CEF report, I should mention some caveats about using coverage as a screen. Firstly, the coverage ratios are calculated using earnings data from CEFConnect. No efforts have been made to independently verify the coverage ratios from the individual fund annual/semi-annual reports themselves. Secondly, having a coverage ratio >90% does not guarantee that the fund's distribution is secure. Many funds reduce their distributions periodically in line with market conditions in order to maintain good coverage. Thirdly, a coverage cut-off ratio of 90% is, ultimately, an arbitrary number. A fund with 89.9% coverage will be excluded from the rankings, whereas funds with 90.1% coverage will be considered, even though only a sliver of coverage separates the two.
I should also note that having both high yields and less than 100% coverage (though greater than 90%) makes this a more aggressive screen compared to the Quality report (which only selects for >100% coverage). Furthermore, note that because the universe of eligible funds is pretty small, some of the CEFs will appear in multiple top lists, just in a different order...
I hope that these rankings of "high-high-low" CEFs will provide fertile grounds for further exploration.
Key to table headings:
P/D = premium/discount
Z = 1-year z-score
Lev = leverage
BE = baseline expense
Cov = coverage
The following data show the 10 CEFs with the highest discounts, yield >7.5% and coverage >90%. Z-scores, leverage, and baseline expense are shown for comparison.
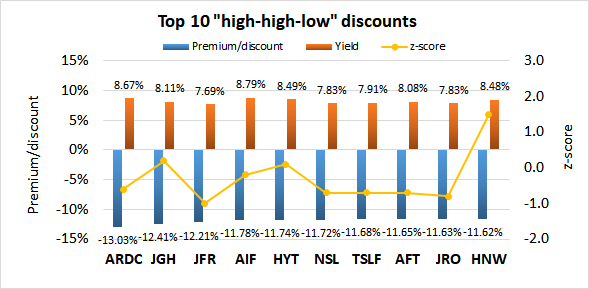
(Source: CEFConnect, Stanford Chemist)
The following data show the 10 CEFs with the lowest z-scores, yield >8%, coverage >90% and premium/discount <0%. Leverage and baseline expense are shown for comparison.
(Source: CEFConnect, Stanford Chemist)
The following data show the 10 CEFs with the highest yields, coverage >90% and premium/discount <0%. Z-scores, leverage, and baseline expense are shown for comparison.
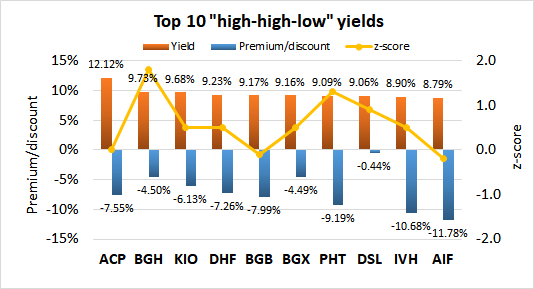
(Source: CEFConnect, Stanford Chemist)
For possible buy candidates, it is probably a good idea to consider both yield and discount. Buying a CEF with both a high yield and discount not only gives you the opportunity to capitalize from discount contraction but you also get "free" alpha every time the distribution is paid out. This is because paying out a distribution is effectively the same as liquidating the fund at NAV and returning the capital to the unitholders. I considered several ways to rank CEFs by a composite metric of both yield and discount. The simplest would be yield + discount. However, I disregarded this because yields and discounts may have different ranges of absolute values, and a sum would be biased towards the larger set of values. I finally settled on the multiplicative product, yield x discount. This is because I consider a CEF with 7% yield and 7% discount to be more desirable than a fund with 2% yield and 12% discount, or 12% yield and 2% discount, even though each pair of quantities sum to 14%. Multiplying yield and discount together biases towards funds with
high yield and discount. Since discount is negative and yield is positive, the
the "
D x Y
" metric, the better. Only funds with >7.5% yield, >90% coverage, and <0% premium/discount are considered.
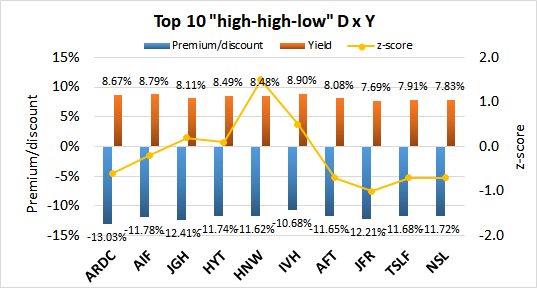
(Source: CEFConnect, Stanford Chemist)
This is my favorite metric because it takes into account all three factors that I always consider when buying or selling CEFs: yield, discount, and z-score. The composite metric simply multiplies the three quantities together. A screen is applied to only include CEFs with a negative 1-year z-score. As both discount and z-score are negative while yield is positive, the
the "
D x Y x Z
" metric, the better. Only funds with >7.5% yield, >90% coverage, and <0% premium/discount are considered.
I am/we are long THE PORTFOLIOS.
I wrote this article myself, and it expresses my own opinions. I am not receiving compensation for it (other than from Seeking Alpha). I have no business relationship with any company whose stock is mentioned in this article.
推荐文章
港股周报 | 中国大模型“春节档”打响!智谱周涨超138%;巨亏超230亿!美团周内重挫超10%

一周财经日历 | 港美股迎“春节+总统日”双假期!万亿零售巨头沃尔玛将发财报
一周IPO | 赚钱效应持续火热!年内24只上市新股“0”破发;“图模融合第一股”海致科技首日飙涨逾242%
从软件到房地产,美国多板块陷入AI恐慌抛售潮
Meta计划为智能眼镜添加人脸识别技术
危机四伏,市场却似乎毫不在意
美股机会日报 | 降息预期升温!美国1月CPI年率创去年5月来新低;净利、指引双超预期!应用材料盘前涨超10%
财报前瞻 | 英伟达Q4财报放榜在即!高盛、瑞银预计将大超预期,两大关键催化将带来意外惊喜?
